In the lead up to India’s 500th test match in Kanpur, various print and online media outlets ran their own all-time India XI compilation articles: Espncricinfo to India Today, Wisden to The Hindu. Most of the squad members selected themselves, except for a couple of surprises. While there was general consensus that it was too early to consider Virat Kohli for an all-time XI (which is totally understandable), there were no murmurs that Ravichandran Ashwin made it to a few teams. Granted, India has always been a batting obsessed country but the spin cupboard was not barren either; India’s had a proud tradition from the days of Subhash Gupte, but that didn’t prevent Ashwin from being selected ahead of legends of days past. This is a testament to some of his achievements and current standing in world cricket.

Ahead of the pack: Ashwin has rapidly vaulted himself into all-time Indian XI slot contention with his recent showings. Image source: 1.
Ashwin has been the talk of the town ever since he remodelled his action; he has taken wickets by the bucket loads and his accomplishments over the last two years have been astonishing, by any yardstick (snide remarks by ex-India players aside). His appetite for wickets has been all too well documented. He is the first Indian bowler to breach the hallowed 900 level in the ICC rankings (similarly, only Gavaskar has crossed the mark amongst Indian batsmen). No other Indian bowler in history is in his vicinity with respect to the ICC ranking points. Hence, the aim of this article is to delve deeper into Ashwin’s standing amongst his peers and cast a critical eye on overseas records of spinners. Does Ashwin have a shot at all-time greatness à la Warne or Muralitharan?
First, we have to set the stage to understand the statistical perspective of a spinner’s canvas. For the purposes of this article, only test matches from 1 Jan 1946 to 20 Dec 2016 will be considered. Let us now proceed to see some popular measures used in cricket to quantify a bowler’s performance.
Strike rate (SR): Deliveries bowled/dismissal
Economy rate (ER): Runs conceded/six deliveries bowled
Bowling average (BA): Runs conceded/dismissal
Wickets per test (WPT): Wickets taken/number of tests played in.
Hence, it can be see that the Bowling average contains information about the Economy rate and Strike rate. Since it is a product of the two, a good (low) bowling average implies low values of the ER and SR. Therefore, we will primarily be using the BA as the first level filter; additional details will be obtained from SR and WPT wherever necessary. All the tables containing the statistics in this article can be downloaded from this link.

Fig. 1: Statistics of subcontinental spinners, ordered by total wickets for country. The leader in each column has been marked in bold.
We can now proceed to examine Ashwin’s record amongst his peers from the countries which boast of a spin-bowling tradition. He tops the table in SR, comes second in BA and bowls 45 balls/test lesser than Ajmal and Murali. That Muralitharan towers over the rest is quite evident from his statistics; he ranks first or second in every parameter. Amongst these spin legends, it is safe to say that his trajectory is moving towards Muralitharan.
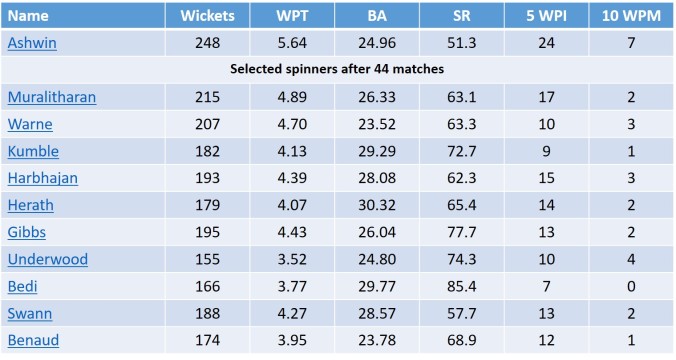
Fig. 2: Comparision of Ashwin’s record against selected spinners’, after the 44 test mark
The extent of Ashwin’s records to date have to be assimilated by understanding the kind of start he has had. No other spinner since World War 2 has grabbed so many wickets in his first 44 matches. Ashwin is in a class of his own with respect to WPT, SR, 5 wickets per innings and 10 Wickets per match. From the above table, it is also easy to see how Murali tipped Harbhajan to break his records. Unfortunately for India, Harbhajan could not kick on from the start he got. At the 44 test stage, Warne and Muralitharan were in a class of their own. Hence, it is imperative to look at the Ashwin’s career trajectory with respect to these two legends.

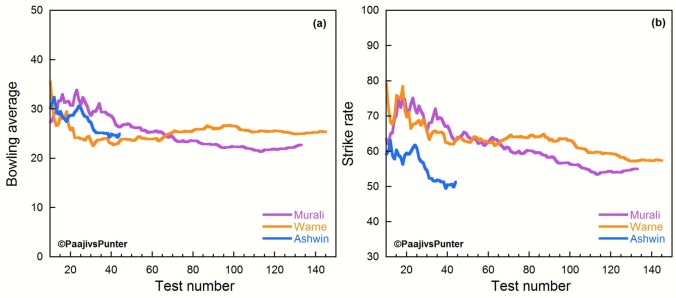
Figs. 3: Variation of Career to date values of (a) Overs per test and (b) Wickets per test for the three bowlers.
The above plots of (a) Overs per test and (b) Wickets per test (WPT) are a progression of the cumulative real-time values. Meaning, the tallies at the end of every match are divided by the number of tests played to get an idea of how the player’s career performance statistics moved with time. To put it another way, these are career to date figures at the end of each test.
At the start, the perturbations to the values are quite large as the number of tests played is quite small. For these plots, the data for the first 10 tests have been taken into account but not shown to avoid the large spikes at the start of everyone’s career. Over time, the plots smoothen and all the values finish at the end of career values (for Murali and Warne). It also follows that creating a larger perturbation is relatively difficult at the end of the career due to the weight of the statistics to date.
From the graphs, it can be noticed that the two legends’ careers moved a bit differently. Both legends needed about 30 tests to get a grip of international cricket. Murali bowled significantly more overs after the 30 test mark, and got more wickets as well. Warne, on the other hand, bowled fewer overs (presumably, as he had to share them with a better set of teammates) but this did not impact his ability to take wickets majorly; his resurgence after the 100 test mark is an achievement in itself. Ashwin’s fortunes have taken an upswing after 25 tests and has bowled lesser overs per test. Perhaps it is more to do with his strike rate, as he has cleaned up sides faster than any spinner since World War 2.

Fig. 4: Comparision of Ashwin’s current wicket taking streak with Muralitharan’s peak
Can Ashwin overhaul Muralitharan’s tally? It will go down to how long Ashwin can keep his current wicket-taking streak going. In 20 test matches since 1st Feb 2015, Ashwin has captured 129 wickets at 19.69 runs/wicket, which is an unbelievable streak. Not considering Muralitharan, that is. The Sri Lankan had a streak four times as long, stretching a scarcely believable 79 test matches: 7.15 WPT, 565 wickets at less than 19 runs/wicket.

Fig. 5: Hypothetical progression of Ashwin’s career wicket tally with respect to Warne and Murali’s careers, at different wicket taking rates.
If Ashwin continues at 6 WPT, he can reach Murali’s mark of 800 around the 136th test mark (provided he plays for so long). India has typically played 8-10 test matches per year and he would be needing a decade of performing at this level in order to overcome that barrier. He will still reach respectable tallies if he can only muster 4-5 WPT instead.
Figs. 6: Variation of Career to date values of (a) Bowling average and (b) Strike rate for the three bowlers.
The career to date (a) Bowling Average and (b) Strike Rate graphs also throw up similar trends to WPT. Muralitharan continuously improved his stats from the 30th test matches till almost the end of his career. Warne had a relatively steady career in terms of his statistics after the initial 30 matches. Ashwin’s strike rate was hovering around 60 balls/ dismissal but his showing in the last 20 test matches has got it to all-time great fast bowler territory. These plots only confirm Ashwin’s progress in the last 2 years or so, but much of his legacy will be dependent on how he is able to perform at this level, and how he bowls overseas (Aus, NZ, SA and Eng).
Ashwin has been rightly criticized for his showing outside the subcontinent before 2015. But what about his recent performances in Sri Lanka and West Indies? Are overseas performances in temperate conditions the Holy Grail for spinners? Is it easier to bowl as an away spinner in the subcontinent? To answer some of these questions, the next step would be to understand the nuances of bowling statistics across host countries. This can be done by examining the differences in bowling averages of home and away spinners. A high BA for an away spinner would indicate that either the home batsmen are competent against spin, or that the conditions are not favourable for spinners (or both). The corresponding BA values of home spinners can also be used to make a judgement; negative values of BA differences (Home spinners BA-Away spinners BA) imply that the home spinners have out-bowled the away ones. In the case of Pakistan, UAE has been designated as a home venue.
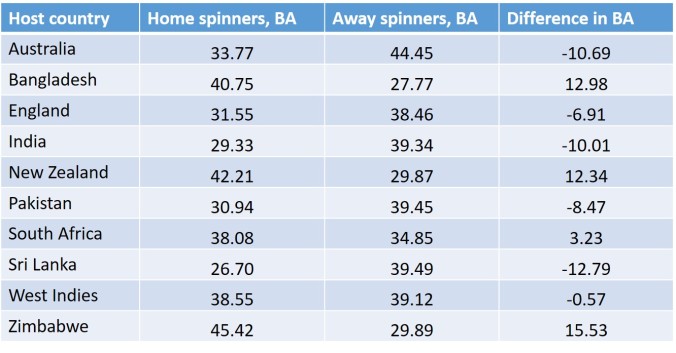
Fig. 7: Overall bowling average of home and away spin bowlers across different countries. UAE has been treated as a home venue for Pakistan.
It can be observed from the table that India, Pakistan and Sri Lanka have been great home venues for spinners – a no brainer; on the other hand, away spinners have traditionally prospered in countries where batting has been weak. There also seems to be some truth to sub-continental batsmen being comfortable against away spinners; though, we don’t have the true picture of this “dominance” as they don’t get to face home spinners. One more thing to be noted here is that these values of BA are not fixed, but move with time based on a team’s strength. As we’ll take note shortly, the home BA values are great even in a non-subcontinental country when a good spinner plays for the home team.

Fig. 8: Variation in home spinner bowling averages at host country over each decade. UAE has been treated as a home venue for Pakistan.
A good way to check this out would be to examine the evolution of BA in different host countries across each decade. A decade is a good unit of time as it would include data from a lot of matches. Of course, there could be an odd case of data missing from a team in transition around the turn of the decade, but a 10 year span is a convenient time span to measure the progress of a team.
Since the overall bowling average of a spin bowler during the time of consideration is ~35, we can use this as a benchmark. From the table, it can be observed that Australia, England or West Indies were not always a barren place for spinners. Low overall values of home spinner BAs can be observed in those locations during the time of Richie Benaud, Jim Laker, Lance Gibbs, Shane Warne, Derek Underwood, Graeme Swann etc. India and Sri Lanka took some time to figure out that spin was their strength. On the other hand, New Zealand and South Africa are yet to see a champion spinner. Of particular interest are class-leading home spinner BA of ~24 for Sri Lanka during the 2000s and ~25.8 for India during 2010s.
How have away spinners fared on tours to different countries during these times?

Fig. 9: Variation in away spinner bowling averages at host country over each decade. UAE has been treated as a home venue for Pakistan.
The above table reveals many insights: Australia has been the toughest place to visit for an overseas spinner; Bangladesh have improved their record against spinners recently; pitches in England assisted spin in Laker’s time (batsmen were perhaps average in the 1990s); once India, Pakistan, and Sri Lanka found their batting giants, touring spinners never had it easy; New Zealand have not been pushovers against spin since the 1980s; South Africa took their time to adjust against spinners; and, the decline of Zimbabwe and West Indies are apparent. In the decade of the 1990s, all teams boasted good records against spinners.
So, which were the best places to tour as a spinner at different points of time?

Fig. 10: Variation in bowling averages differences (home spin BA- away spin BA) at host country over each decade. UAE has been treated as a home venue for Pakistan.
Using the same difference in bowling average measure, we can find periods in cricketing history when away spinners dominated over the home team. Here too, several patterns emerge: The 3 older subcontinental teams have rarely been outdone by their counterparts; England’s spinners underperformed for 3 decades; New Zealand has been a happy hunting ground until recently, the opposite holds true for the Windies; Australian spinners did not do well at home in the ‘70s; South Africa has never had a spin bowling champion; Bangladesh are fast closing the gap and Zimbabwe have slipped to oblivion. With all this information in hand, we can come to the following conclusions:
- Fledgling teams take some time to get comfortable against spin, even in home conditions.
- By the time batting strength is developed at home, away spinners are not as effective.
- In general, home spinners do better than away spinners when teams are of similar strengths.
Using this, we can now prepare a list of selected host countries (discarding records where away spinner BA<30) to separate the wheat from the chaff. Why? We mustn’t forget that many aspersions have been cast on Warne’s and Murali’s records due to their tallies against England, Bangladesh and Zimbabwe at various points of time during their career. Hence, we need to address this issue of opposition quality adequately using exclusions.

Fig. 11: List of host countries in each decade where the home team has had a poor record against away spinners (BA<30). These host countries were excluded from the away spinner BA analysis for each decade.
We can now proceed to examine spinner performances away from home across different time periods, keeping in mind these exclusions; we wouldn’t want to set the bar low, would we?

Fig. 12: List of spin bowlers with (minimum number of away wicket cutoff applied) BA
For the eight decades in question, we need to come up with an objective selection criteria. The number of minimum wickets captured by a bowler is a function of the length of the decade and the number of matches played away against opposition with “good” credentials of playing spin. In the first decade under consideration, no spinner averaged less than 30 away (all countries except NZ). The top spinner was Jim Laker, who averaged a shade over 30 in this war-truncated decade (minimum 15 wickets). Moving on to the 1950s, the bar can be set at 25 away wickets, which would translate to tallies over at least 2 series. There are four spinners who have excellent away figures, led by the illustrious Richie Benaud. During the decade, his wicket taking feats were ably supported by Davidson, Lindwall and Miller. The pattern repeats for Tayfield, Valentine and Laker, the other spinners in this list; every one of these bowlers had the support of fast bowlers who similarly averaged less than 30 in these conditions.
The same motif repeats itself in all the other decades; spinners from teams having a good set of fast bowlers have much better returns against the “good” teams in away conditions. Tweakers like Hedley Howarth (NZ), Geoff Miller (England), Roger Harper (WI) and Paul Adams (SA) boast a better record when compared to noteworthy names such as Prasanna, Chandrashekhar, Bedi, Qadir, Kumble and Harbhajan. The only spinner to buck this trend of having fast-bowling support is peak level Muralitharan in the ‘00s – snaring his victims at nearly 29 runs/dismissal, a far cry from the sub-20 levels he hit during in his pomp. For the last 3 decades, the bar has been set at 40 wickets since the number of host countries has increased. In the 2010s, no bowler has been able to average at less than 30 runs/dismissal. The top bowler is Saeed Ajmal, who was slightly over the benchmark. Unsurprisingly, he had Mohammad Amir’s support during this current decade.
These trends shouldn’t come as a complete surprise to the cricket fans who’ve followed the game for a while. On an average, fast bowlers have better bowling returns compared to spinners; the most successful test teams of all-time boasted of some fearsome quicks in their pack; the bowling is opened by the pacers, who set the agenda for the spinners to follow; bowlers tend to bowl better with a better peer-group. Thereby, spinners profiting from the inroads made by fast-bowling colleagues follows as a natural consequence.
On this note, the odds are very much against Ashwin bowling really well abroad against the better teams, given the lack of Indian fast bowling pedigree. Then again, Ashwin has achieved more than any spinner during the start of his career (except perhaps Clarrie Grimmett). Like his predecessors, he needs to maximize his returns against the “weaker” away teams such as Bangladesh, West Indies, Sri Lanka and New Zealand and hope for an odd good series against the rest. India would certainly hope for Mohammed Shami and co. to develop as all-weather fast bowlers to aid him in his quest. All said and done, a fascinating sub-plot lies in front of us this time next year, when India tour South Africa.
Disclaimer: Some images used in this article are not property of this blog. The copyright, if any, rests with the respective owners.
