A World cup squad for the ages

The quadrennial cricketing extravaganza that is the Cricket World Cup begins in less than 48 hours when England take on South Africa. The sports pages of every news publication, online and offline are filled to the brim with stories about the players, squads and unforgettable moments of yesteryear. With excitement building up towards this grand, we decided to throw our hat into the ring with a fun exercise of our own—building a hypothetical all-time XI.

What would serve as a fair selection criteria that can be applied across the board to facilitate such an exercise in fandom? Firstly, only performances from the ODI World Cups will be considered. Secondly, the player should have played in at least 10 World Cup matches and 2 editions; this criteria is to ensure that players with a stellar showing in one tournament (for example, Shikhar Dhawan) don’t necessarily upstage players with longer, more consistent World Cup records. As a consequence of these two criteria, many players with stellar ODI records (thinking of you, Virat Kohli and Joel Garner) unfortunately miss out, but present-day players certainly have a chance to correct this in the future. The squad would nominally have 6 batsmen (2 of whom can serve as the 6th bowler), 1 wicketkeeper-batsman, 4 bowlers and 1 all-rounder but there is scope for some flexibility. With this in place, let us move on to the players themselves.

Wicketkeeper-batsman

Four wicketkeepers have stellar World Cup records: Adam Gilchrist, Kumar Sangakkara, Brendan Taylor, and Brad Haddin. Both Gilchrist and Kumar Sangakkara have had longer and more productive careers compared to the other two—hence it is down to these two. Both are excellent glovemen and hence the debate between the two will come down to batting (see below).

Top order (1-3)

One name automatically makes the list: Sachin Tendulkar. Who can argue with the batting pitamaha’s overall record and a stellar showing in three world cups? The identity of the other two players will no doubt cause much deliberation. Will it be his illustrious batting partner, Sourav Ganguly? Or explosive southpaws such as Adam Gilchrist or Sanath Jayasuriya? We then looked at players who married consistency with strike rate at the top, leading to 4 other contenders—Mark Waugh, Herschelle Gibbs, Matthew Hayden, and Tillakaratne Dilshan. Despite Dilshan’s edge as a part-time bowler, the fact that his best performances came against the “lesser” teams put him out of contention. With little to choose between the other three, we chose Matthew Hayden for his left-handedness and higher strike rate.  For the number 3 slot, Kumar Sangakkara’s consistency was hard to overlook and he easily towers over Ponting, Kallis, and Lara. A case could be made for playing both Gilchrist and Sangakkara but Hayden’s advantage (~+15 average) won the trade-off against Gilchrist’s stats (~+5 strike rate). Besides, we have packed the side with plenty of firepower in the middle order.

Hayden: 22 matches, 987 runs @51.94 avg. and 92.93 SR

Tendulkar: 45 matches, 2278 runs @ 56.95 avg. and 88.98 SR

Sangakkara: 37 matches, 1532 runs @ 56.74 avg. and 86.55 SR, 41 catches and 13 stumpings

Middle order (4-6)

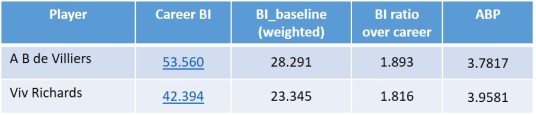
As was the case in the top order, one more name automatically makes the list at number 4: Viv Richards; his handy bowling and fielding complemented his destructive batting well. The following act is a recent-day player who probably was the closest to Richards in his pomp—A B de Villiers. The number 6 and 7 candidates are some of the hardest to fill—is it better to pick someone like Javed Miandad, or Steve Waugh, who can marshal the lower order and bring in the big hits when necessary? Ultimately, we went with flexibility and power as the top 5 have enough batting ability and consistency to stave off even the most hostile bowling attack.

Viv Richards: 23 matches, 1013 runs @ 63.31 avg. and 85.05 SR

A B de Villiers: 23 matches, 1207 runs @ 63.52 avg. and 117.29 SR

All-rounders (6-7)

There are only 4 players under consideration—Imran Khan, Kapil Dev, Yuvraj Singh, and Lance Klusener. Imran Khan has an outstanding bowling record but his batting is less than stellar. Following Viv Richards and A B de Villiers is already a difficult task and his ~66 SR would be out of place, even if it were to be “inflation-adjusted”; Lance Klusener has an amazing batting and bowling record in the World Cups and he would totally fit in in today’s T20-fuelled era; Yuvraj Singh is more a part-time bowler who had one good World Cup bowling-wise. Kapil Dev’s World Cup bowling record is merely “average” by his own lofty standards but his batting takes the cake—who can forget his immortal 175* against Zimbabwe? In the end, it is a very tough call between Kapil Dev and Imran Khan but considering that the top 5 are very consistent, we went with batting power over bowling chops. Kapil, Klusener, Richards, and Tendulkar can more than capably bowl the 5th bowler quota.

Lance Klusener: 14 matches, 372 runs @ 124 avg. and 121. 17 SR; 22 wickets @ 22.13 avg.

Kapil Dev: 26 matches, 669 runs @ 37.16 avg. and 115.14 SR; 28 wickets @ 31.85 avg.

Fast bowlers

For the fast men who will take the new ball, it is hard to look beyond two legends of the game—one known for unerring and nagging consistency, and the other, the sultan of swing. Yes, we are referring to Glenn McGrath and Wasim Akram. Unsurprisingly, they have the highest number of wickets in the World Cups (fast bowlers only). Other capable candidates such as Chaminda Vaas, Zaheer Khan, Lasith Malinga, Brett Lee, and Shane Bond miss out due to the illustrious careers of these two new ball schemers.

Wasim Akram: 38 matches, 55 wickets @ 23.83 avg.

Glenn McGrath: 39 matches, 71 wickets @18.19 avg.

Spinners

Here too, it is difficult to look beyond the two champion spinners of the game—Muttiah Muralitharan and Shane Warne. Though Warne has played only in two World Cups, his overall record pips him to the final bowling slot ahead of Vettori, Hogg, and Kumble.

Muttiah Muralitharan: 40 matches, 68 wickets @ 19.63 avg.

Shane Warne: 17 matches, 32 wickets @ 19.50 avg.


Squad balance and captaincy

Overall, the squad has it all—consistency at the top and middle, explosive power in the middle order, left-right combinations galore, a bowling quiver full of all types of arrows, lower-order batting in Akram and Warne, and even comic value in two genuine number 11s. Who will be the captain? Imran Khan would have been an obvious choice had he made it, but since we’re picking the captain after making the 11, we would pick Kapil Dev. Kapil Dev was even more crucial to India in 1983 than what Imran was to Pakistan in 1992, and he transformed a bunch of no-hopers to world champions against all odds through a mix of self-belief, inspiration, and leading from the front. Imran, on the other hand had an excellent bowling unit and decent batsmen coming up the ranks. For this reason, Kapil paaji da jawaab nahin. The cerebral Sangakkara will serve as his able deputy.

All time World-cup 11: Matthew Hayden, Sachin Tendulkar, Kumar Sangakkara (wk & vc), Viv Richards, AB de Villiers, Lance Klusener, Kapil Dev (c), Wasim Akram, Shane Warne, Muttiah Muralitharn, Glenn McGrath

The Batting Avengers

The year is 2030. A group of aliens have landed on Earth and made their way to the BCCI headquarters. For some unknown reason, they’re interested in the game of cricket. Since this hypothetical situation is set in the world of cricket, India happens to be at the centre of the universe. Therefore, this time, we will imagine that a big spaceship landed in the middle of Madhya Pradesh rather than somewhere in the United States as Hollywood portrays it all the time.

In 2030, citizens are waking up to newspaper editorials bemoaning the absence of a genteel, father figure like Virat Kohli from the Indian team and are wondering what the world has come to with the boisterous, unruly bunch dotting the lineup. Bangladesh have become the second best team in Asia and are challenging the big teams regularly in all formats. The structure of international cricket has changed with the BCCI pulling the plug on international engagements, and have expanded the IPL to include the test and one day internationals. The international game now has friendlies and the big tournaments; T20 is still king of club cricket though. The Royal Challengers Bangalore are yet to win a title—both sets of fans (their fanbase and their opponents) regularly give vent their contrastive feelings through communal drinking. Perhaps this was Mallya’s business plan all the way along.

Somehow, in the midst of all this, rather incredibly, the one day international (ODI) format is still in vogue. It has withstood the onslaught of the shorter format. Some things haven’t still changed though: Australia are still an annoying team that everybody hates; England are yet to win a World Cup; Bishan Singh Bedi is still critical of the establishment; there is still no distinction between the English and South African teams either on the field or matters of birth—they both choke at the final hurdle with regularity.

The aliens barge into the BCCI office and throw a cricketing challenge: the best alien players will face-off against Earth’s best in a winner-takes-all ODI series. And since the aliens wish to be taken very seriously, they make sure that they go through the Supreme Court lest their intentions are mistaken to be frivolous.

The stakes are high in this hypothetical series. The all-powerful aliens would spare Earth of its subjugation if the earthlings were to win—teen guna lagaan and all that. The heads of various cricketing establishments get together to assemble a team of Earth’s mightiest heroes to fight the aliens in an Avengers-meet-Armageddon premise. Since this would be mediated by the Supreme Court, it is perhaps more appropriate to call it the Justice League.

This hypothetical fanboy exercise is a culmination to parts 1 and 2, where we’ve looked at batsmen who outperformed their peers in a run chase and setting a target respectively. Who would make the cut amongst the batsmen culled from the history of the ODI format? Could we use analytical techniques to come to arrive at this bevy of bewitching batmen?

What do we already know about ODI batting?

The ODI format hasn’t been a structural monolith, but has continuously evolved with time. As a case in point, Sunil Gavaskar infamously batted through 174 balls for his 36* in pursuit of England’s 334 in 60 overs in the inaugural world cup; though other openers of the time didn’t follow the soporific approach, they largely batted with an aim to preserve wickets at the top of the order. It is hard to imagine today’s ODI openers having the same approach. Run-rates have been on a continuous upward climb since the 1992 World Cup, and so have been the attitude of batsmen at the top of the order.

An ODI batsman has to master two variables during his stint in the middle: one, the wickets remaining; two, the balls remaining. For a batsman facing a target, the runs to get forms the third variable which determines his approach. Therefore, in general, the effectiveness of an ODI batsman is determined by how many runs he scores per dismissal (batting average) and how fast he scores his runs per 100 balls (strike rate). The product of the two—labelled the Batting Index (BI)—has been used by ESPNcricinfo and others as an index to benchmark batsmen against the average batsman of their times. By dividing a batsman’s BI with the corresponding product of an average batsman (positions 1-7) during their career (BI baseline), a BI ratio has been used to ascertain the various levels at which various batsmen outperformed their peers. As it can be seen in the below tables, the BI baseline has seen a continuous increase with each era at all batting positions.

1

Table 1: Variation of Batting Index (chasing) across the batting order in different time periods

2

Table 2: Variation of Batting Index (setting) across the batting order in different time periods

Additionally, the analyses from the first two parts revealed several other insights. One, it has shown that chasing a target and setting one are two different propositions with respect to the BI. Two, in the first three eras of the ODI, the middle order was the best place to bat. In the present day, the BI values are more or less flat across the top 5.

3

Table 3: Variation of BI chasing(%) using setting target as a reference. Eg. BI chasing is 15% higher for 1&2 compared to BI setting between 71-84. (BI chasing-BI setting/BI setting)*100

In the previous two exercises, this BI concept was further developed to see which batsmen dominated the world with their performances during different ODI eras (9 in total) by computing and comparing BI ratios while setting and chasing ODI targets. A BI ratio of 1.4 implies that a batsman’s BI is 40% higher than the BI baseline during a particular era. A BI ratio level of 1.4 is extremely rare, and less than 20 players have achieved it during each era (with a minimum runs scored cutoff, of course) either while setting the target or chasing one. Many batsmen have shone in one particular era but have struggled to maintain their lofty heights in other eras—barring a few batting maestros. A champion batting team has boasted of a handful of these players—in the form of their lives—and has generally tasted international success during the era.

Now would this ODI series be played with fielding restrictions? Under lights? Two balls? 50 overs? Will Tendulkar be marked as the marauding player of the late nineties or as the player who would time the ball and nudge around for boundaries in the mid-noughties? Would Rohit Sharma be considered as an opener or as a middle order player—why is he considered at all? So many questions.

Therefore, any exercise that compares a player from, say, 20 years ago with a current one is fraught with difficulty and some ground rules must be set. A cut-off of at least 75 innings at 30 runs/dismissal until 31 December 2016 seems reasonable as it brings 143 batsmen under scrutiny, the least amongst these having scored 1874 runs. The individual metrics used to obtain BI are the traditionally used batting average (runs/dismissal) and strike rate (runs/100 balls) with runs made in all international ODI matches until 31 December 2016 being used in the analysis.

Rather than just ground-breaking statistical peaks, the duration for which the batsmen dominated the rest of the field will be given its due (readers can peruse era-centric values in the earlier pieces) unless the lofty peaks cannot be overlooked. And, the analytical criteria has to take the vagaries of setting/chasing, ODI eras, and the batting position into consideration.

The method used in the first two parts (using a common BI baseline across the board for a particular era) is a good first cut, but it heavily favours the middle order batsmen. How fair is it to use the same BI baseline for Vivian Richards (a middle order batsman) and Gordon Greenidge (an opener) when the BI baseline for openers is ~30% lesser than that of a middle order batsman in the first era? Traditionally, the BI baselines for middle order batsmen are the highest, but this method divides everyone’s BI with the average batsman’s (1-7) BI.  The BIs of batsmen batting at 6 and 7 are especially lower than the top five, and hence are under-represented in the various tables seen in parts 1 and 2. So what about players like Kapil Dev who batted at the end of the middle order for most of their career? What about batsmen like Kohli who’ve been fantastic in the chase but merely good while setting the target? Hence, a tweak has to be applied to the BI baseline which is based on the batting opportunities that the batsman got during his career.

The Average batting position (ABP) is a number representing the average of all the batting positions batted by the batsman. While the ABP alone can’t be taken as a sacrosanct figure (as a similar ABPs can be manufactured with different mashups of batting position distributions), it does have its utility as it can give a rough indication of a batsman’s most frequent batting position.

Using the same principle, the fraction of innings batted at each position, era, and set/chase can be multiplied with the respective BI of all batsmen who batted in similar circumstances (values in tables 1 and 2), which can then be summed to get the BI baseline (weighted) for that batsman. In a sense, we would be comparing the particular batsman’s  BI with a hypothetical, composite, average batsman—one that would have batted in identical conditions with respect to batting positions, set/chase and ODI eras during his career.

Now to the selection of the batsmen.

Up until 31 December 2016, an ODI match has produced ~54k wickets in ~2 million deliveries bowled—or a wicket every 37 balls. Top ODI batsmen average ~40-50 runs per dismissal at a ~90 strike rate, and hence 7 such capable batsmen would suffice for the heavy lifting.

Ideally, the batting order should comprise of seven competent batsmen with one of them being a wicket-keeper and one of them should also serve as the 5th bowler (and two more in the batting order should be able to bowl a few overs as a backup). The seventh player could also be a bowler or a bowling all-rounder, but for the purpose of this exercise we will be looking at all-rounders who were primarily known for their batting prowess but could also bowl the full quota of their overs. The selected batsmen would mostly bat in and around their most popular batting positions. The selection will be divided into different phases—openers, numbers 3, 4 & 5, 6, 7 based on BI baseline similitude in different eras.

4.jpg

The peerless Sachin Tendulkar leads the way among batsmen who have batted primarily in the opening slots. His overall performance is nearly 1.6 times a hypothetical batsman afforded similar batting opportunities during the course of Tendulkar’s career eras. What is even more remarkable is that Tendulkar had a middling record as a middle order batsman until 1994, and his overall numbers have to be seen in this context.

A notch below him are Gordon Greenidge and Hashim Amla, separated by the third decimal point. It must be noted that Amla is an active batsman (as are Warner and de Kock) who has batted in 147 innings compared to Greenidge’s 127, and there is no saying which way his career statistics would move over the next few years. His innings/50+ score is amongst the highest and hence he would shade Greenidge on this count. Gilchrist, Hayden and Sehwag have had fantastic records as well.

The number 3 batsman needs to be a pivot onto the middle order, and be able bat in a variety of ways; if an early wicket should fall, he must be able to compensate by scoring big, or if given a good opening stand, provide a stable platform and take the match to the endgame. A big scoring ability, and way to keep the scoreboard ticking are key attributes.

5.jpg

In a relatively short career span, Virat Kohli has separated himself from the rest of the chasing pack, followed by Dean Jones. Kohli towers over his contemporaries such as Williamson and Root who have good credentials at number 3. Ponting, Lara and Kallis have excellent numbers in spite of their lengthy careers. A special note needs to be made about Pakistan’s Zaheer Abbas who outperformed his peers at a very high level but didn’t make the cut as he batted in only 60 innings.

The middle order is backed by two batting bulwarks who select themselves without a semblance of a contest. Keep in mind, many of the players in the other tables have batted in a variety of positions from 3 to 6 all through their career.

6.jpg

Due to the BI baseline (weighted) tweak, Richards climbs down from his top position and is overtaken by de Villiers. Perhaps we have an answer to which current day batsman is closest to Richards’ level of performance which was two decades ahead of its time. Richards’ illustrious contemporaries like Greg Chappell and Clive Lloyd have played lesser innings than the cut-off (and have much lower ratios).

7.jpg

India’s MS Dhoni shades Bevan and Hussey for the number six slot due to his high BI ratio, his finishing ability and his big hitting capabilities. He’s also the favourite to take the wicket-keeping position ahead of Adam Gilchrist.

Now for the last batsman who should be able to hit the ball a mile from the word go. There is also the small matter of selection of an all-rounder who can bowl a bit. Where would this all-rounder play? At the top? In the middle order? Or at the end?

8.jpg

Lance Klusener has outperformed his BI baseline at levels higher than the middle order champions; 75 innings old Jos Buttler has made a promising start to his career as well but his selection would be based on future feats. Who knows, he may be able to displace Dhoni from the wicket keeper slot. Other all-rounders such as Symmonds, Watson, Kapil Dev and Kallis are multiple notches below Klusener’s levels of performance. Viv Richards and Tendulkar would be able to roll their arms over in times of bowling need.

There you have it—the cricketing world’s version of The Avengers to avenge the earth. The batting order would read: Amla, Tendulkar, Kohli, Richards, de Villiers, Dhoni (wk) and Klusener. Fancy a bowl against these mighty men?


I feel the need….. the need for speed

You're dangerous Maverick: The movie that catapulted Tom Cruise's action hero credentials to the public consciousness

You’re dangerous Maverick: The movie that catapulted Tom Cruise’s action hero credentials to the public consciousness. Image source: 1

In 1986, the movie Top Gun ruled the box office, raking in more than 350 million dollars. The movie was centered on kinship with a fellow wingman, dangerous piloting skills, classic rivalry and a man who was yet to be synonymous with the mission impossible franchise. The movie made the thirst for speed and living dangerously sexy. The movie put bums on seats but did not win any of the major awards at the Academy. The movie was credited with the surge in sales of the Ray Ban Aviator model and a 500% increase in the number of men wanting to be Naval Aviators. I was far too young in 1986 to remember the iconic quote from the movie which typified “Maverick” but years later, when I caught it on Satellite television, it was already a rite of passage for high school boys in India eager to demonstrate a grasp of “other” cultures. Many a superstar has vied for the crown of the all action Hollywood star but even today, at 50+, few can match Tom Cruise in his sheer penchant for high octane action. The iconic quote inspired a racing game series, which in turn had a symbiotic relationship with the Fast and Furious franchise. The basic premise was built on the viewing thrill of a protagonist’s adrenaline being fuelled by the need for speed.

Sehwag is the only batsman alongside Bradman to have scored over 250 four times and over 290 three times in test cricket. Image source: 2

Sehwag is the only batsman alongside Bradman to have scored 250+ four times and 290+ three times in test cricket. Image source: 2

One could be mistaken for making the association of Sehwag’s career with the very same set of words. After all, the much loved Paul Walker from the Fast and the Furious franchise had a character timeline overlapping with Sehwag’s. Rajesh and Sidvee have deconstructed Sehwag’s legacy in the Indian team in their own very contrasting ways. Sehwag’s buccaneering style brought a smile to a country which wanted to define its own place in the world, poignantly captured- in a narrative of Gavaskar, Tendulkar and Sehwag intertwined together with India’s story- by an American in the midst of the 2011 World Cup. The numbers are there for everyone to see; Sehwag has 4 out of the top 6 highest scores made by an Indian in a test match. For a generation so used to seeing the 236* as the proverbial four minute mile from a bygone era, the floodgates opened from 2001 with 9 forays into unchartered waters with Sehwag as the most frequent navigator. This exemplified India’s golden age of batting more than anything else.

Sehwag’s record as an opener is exemplary- amongst the openers who have scored 5000 test runs, Sehwag is perched in the company of other illustrious batsmen such as Hutton, Hobbs, Hayden and Gavaskar as the only men to average above 50. As many statisticians have pointed out, Sehwag is in a league of his own in the strike rate as an opener measure, a lofty 83 with others in the whereabouts of 60 since 2001 (minimum 5000 runs). The numerical value of SR at 83 has its own significance- it means that Sehwag scored at a run rate of ~5 when the rest of the world scored at 3.24 (SR of 54). Adam Gilchrist, of the swashbuckling blade that followed 5 batsmen who scored at 45+ per dismissal, is the only peer who is in the neighbourhood of Sehwag in the last 20 years. This is an exemplary achievement considering that only 20 men have scored 5000 runs at a greater strike rate in the ODI format, with Richards, Jayasuriya and Tendulkar as the only players to make their debut before 1996.

A shot in time, saves nine: Sehwag, on account of his quick batting, has saved more overs than any other test cricketer. Image source: 3

A shot in time, saves nine: Sehwag, as a result of his quick batting, has saved more overs than any other test cricketer. Image source: 3

A knock- on effect of Sehwag’s blitzkrieg strike rate is his balls faced per dismissal. Sehwag has one of the lowest balls faced per dismissal (60) as a consequence of his high strike rate (discounting lower order batsmen of course). To put this into perspective, other top notch batsmen (average ~50 for whom ball by ball data is available), clock in at least 100 balls per dismissal as they score at a serene 50 SR. In other words, for scoring the same 50 runs, Sehwag saves ~6.4 overs per dismissal at a bare minimum. If we stretch this to further to Kallis/ Dravid territory (123+ balls per dismissal), Sehwag gave his teammates an extra 10.3 overs by the time he scored his 50 runs and got dismissed. The impact of the extra overs to bowl out the opposition cannot be discounted. Hayden and Smith were part of sides which had their bowling attack dismiss a batsman every 60 balls. This implies that when Australia & South Africa were winning test matches, they were conceding 600 runs and in turn dismissing the opposition in 200 overs (a little over 2 days). In contrast, India with a pedestrian bowling attack had to face the double whammy of conceding 35 runs per wicket and bowl an extra ~1.2 overs per dismissal. The corresponding figures that India would accrue are 700 runs after managing to dismiss the opposition twice, thus staying on the field for 25 overs extra. By virtue of India’s poor bowling attack, not only were India 100 runs behind overall, but were also on the field for almost a full session. This only implies that for every 50 that Sehwag scored, he gave India a better chance of victory. Since his appetite for big scores was legendary, he gave India an extra 20 overs (at the very least) on his own account to dismiss the opposition twice every time!

Progression of career strike rates of Sehwag, Hayden and Smith. Quite clearly, Sehwag has been the most destructive opener in the history of Test cricket.

Progression of career strike rates of Sehwag, Hayden and Smith at the top of the order in the test format. Quite clearly, Sehwag has been the most destructive opener in the history of Test cricket.

Amongst Sehwag’s contemporaries, only Hayden and Smith are of comparable stature, deeds and statistics (SR ~60, Average> 49). But here too, Sehwag is in a one man club when his strike rate is considered. The extent of his dominance over his two other illustrious peers is illustrated in the fact that Sehwag’s lowest ever career strike rate is comparable to the highest ever career strike rates of Hayden and Smith. In the time period of 1 January 2001 to 31 December 2013 (the corresponding years that Sehwag played for India), Australia, South Africa and India were the teams with the best W/L ratio and batting averages. Coincidentally, the three openers played with some terrific batsmen down the order. The fact that each player has 3 other players below them in a stable batting order averaging over 49 has a nice touch of symmetry to it (over 3500 test runs). Here too, the Australian team was in a different zone with 4 other players in the 45 to 49 runs per dismissal band and if the bar is set lower at 1000 runs, the list is infested with ten Australians in all. Clearly, the Australians were able to find personnel to perform at a high level even after key personnel retired/ were dropped and this was a cornerstone to their success.

A plot of the percentage of (a)Wins from the total innings of 50+, 100+ and 150+ scored by top batsmen from Ind, Aus and RSA in Sehwag's time. * Indicates that only figures as an opening batsmen have been considered for parity.

A plot of the percentage of (a) Wins from the total innings of 50+, 100+ and 150+ scored by top batsmen from Ind, Aus and RSA in Sehwag’s time. * Indicates that only figures as an opening batsmen have been considered.

Proceeding to examine the hypothesis of Sehwag’s whirlwind batting at the top of the order, one has to see the relative merits of scoring big and their concomitant effects on the result. Considering that a batsman has historically scored at ~37 runs per dismissal in the case of a win or a draw and ~21 in a defeat, a big score by a key batsman can have profound implications in the result of a match- mostly, a victory or a draw. Of course, the maxim of a side having to take 20 wickets to win a match rings loud and clear but the underlying effect of scoreboard pressure and setting up a match cannot be ignored. A key assumption made in this analysis is that with a greater score individual score being amassed, on an average, has a greater chance of a big team score being made and thus swinging the match in favour of the batsman’s team. Upon observing the historical trends of instances of a particular result occurring upon a batsman scoring over 50, over 100 and over 150 respectively, several patterns become clear. In spite of having similar batting giants dot the batting lineups of three winningest teams in the aforementioned period (1 Jan 2001 to 31 Dec 2013), the effect of a good bowling lineup is there for everyone to see. In general, scoring big is a guarantee to higher percentage of instances of victory and draws. However, for Indian batsmen, only Dravid is within sniffing distance of the level achieved by the Oz and Saffers; he has been on the winning side 60% of the time, that too after scoring a 150. Indian batsmen usually languish in the 40- 50% band, whereas, the batsmen from the other teams with better bowling attacks were able to force a favourable result for their respective teams.

3- Loss%

A plot of the percentage of (b) Losses & (c) Draws from the total innings of 50+, 100+ and 150+ scored by top batsmen from Ind, Aus and RSA in Sehwag’s time. * Indicates that only figures as an opening batsmen have been considered.

A draw has been the most likely outcome when an Indian batsmen has scored big which is a damning indictment on the Indian team’s bowling inability to close out a match after piling on the runs. Universally, scoring big is the surest way to avoid defeat but this result should not come as a surprise given the very premise. Every batsman barring Hayden have featured in lesser defeats (% wise) after scoring a big hundred. A special mention should be made to the bullet proof batting lineup of the South Africans; every time Smith has scored a 100 or Amla/ Kallis/ de Villiers have scored a 150, their team has never lost! That this holds true from Kallis’ timeperiod to date is even more impressive.

A histogram of (a) India's run rate versus Sehwag's strike rate. India has outscored Sehwag's career strike rate only once, that too with Sehwag's 200.

A histogram of (a) India’s run rate versus Sehwag’s strike rate. India has outscored Sehwag’s career strike rate only once, that too with Sehwag’s 200.

And now to the end product of Sehwag’s heroics- the result. India have never been able to capitalize on Sehwag’s blazing starts. He’s the only batsman in this elite bunch whose likelihood of victory went down (correspondingly, the likelihood of a draw increased) with each addition of 50 to the individual score. His Win% drops from 42 to 27 when he zooms from 50 to 150 (in spite of him saving 6 overs per 50 additional runs scored, on an average). And given that he has scored pretty quickly, it only means that India have not put the extra overs that Sehwag has earned to good use. The Loss% has dropped no doubt but India have had a tendency to pile on the draws whenever Sehwag scored big. An explanation to this puzzling conundrum can be obtained upon perusal of the run rates that India have scored at. Sehwag has got a start (at least 20 runs) in 102 out 180 innings as an opener; only 2 of these innings have a SR of 50 (RR= 3) or lower and 12 are below SR of 67 (RR= 4). It is a result of these fantastic combustive ability that Sehwag’s lowest cumulative batting strike rate as an opener is an incredible 65, that too way back in 2002. Of all the matches that India have played with Sehwag in the side, only 11 of 103 matches have been above this run rate mark of 4. Keep the benchmark at Sehwag’s career run rate of 5 runs per over, only 1 match makes the cut. Unsurprisingly, Sehwag’s blitzkrieg 200 played a huge part in the run rate being 5 in the first place.

6- Hayden

On the other hand, (b) Australia and (c) South Africa have scored at a faster rate compared to their respective opening batsmen, Hayden & Smith. The distribution of the histograms shows a greater number of innings clustered over the 3.8 RPO mark.

On the other hand, (b) Australia and (c) South Africa have scored at a faster rate compared to their respective opening batsmen, Hayden & Smith. The distribution of the histograms shows a greater number of innings clustered over the 3.8 RPO mark.

Simply put, India have never been able to press home the advantage once Sehwag got dismissed and at many times, batted apologetically at a lesser pace- as if to compensate for the carnage that had unfolded. On the other hand, Australia and South Africa scored at a comparable pace to the career strike rates of Hayden and Smith and in some cases, even higher than their highest cumulative career strike rate. Granted, Hayden and Smith did not bat at the same rate as Sehwag but even if we could hypothetically consider, rather sacrilegiously, that Sehwag were to be a part of these Australian and South African sides, they were more likely to follow his fireworks with some more of their own. The Indians, more often than not, were content in bringing out the sparklers once the big firecrackers blazed brightly against the festival sky.

Cruise and Sehwag: Two of a kind; both have accomplished pretty astonishing feats. Caution: These stunts are performed by professionals. Please do not try this at home. Image sources: 4 & 5.

Cruise and Sehwag: Two of a kind; both have accomplished pretty astonishing feats, best enjoyed on prime time TV. Caution: These stunts are performed by professionals. Please do not try this at home. Image sources: 4 & 5.

Sehwag’s detractors will be quick to point out that he made his big runs in Asia. While this may be true, not all of his knocks came on featherbeds. The sight of a spinner made him bring out the heavy artillery and he played with the mentality of a big game hunter. Others may point to majority of his big hundreds resulting in draws and imply that he scored easy runs and found the going tough on seaming pitches. And many others would simply blame his inability to bat for time, forgetting the very essence of Sehwag which changed the complexion of a match and made chasing 387 possible. This lingering sentiment encapsulates the hold that Sehwag has on us; like Tom Cruise, he’s never really been an actor who has won the plaudits for the depth & range of his craft. Yet, one can put his/ her money on him to make the most death defying stunts seemingly in range, even at an older age. To bring a smile to the face and some popcorn when he’s on the screen. Put bums on seats and bring some life to the turnstiles year after year. And get a warm, fuzzy feeling of nostalgia whenever “Take my breath away” or “Danger zone” or “Playing with the boys” is requested on the radio.

 Disclaimer: Some images used are not property of this blog. The copyright, if any, rests with the respective owners.