
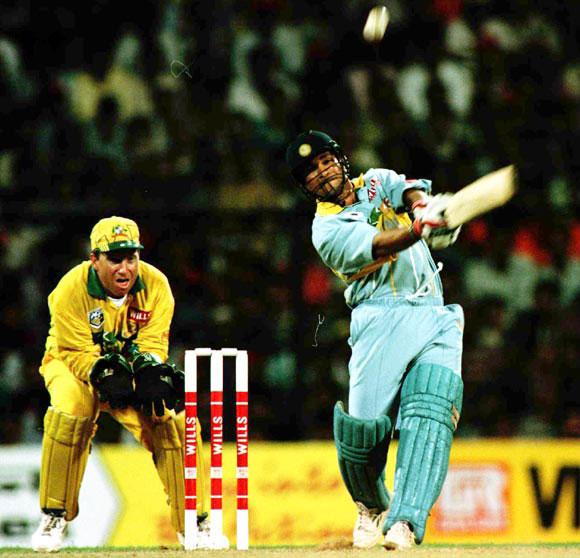
Yuvraj Singh, the pie chucker who came up trumps in the 2011 World Cup. Image source: 1.
“You will matter when it matters the most”
These were the very words which served as Yuvraj Singh’s inspiration during the 2011 World Cup. When the squad was announced a month in advance of the tournament, there were a few surprises in store. For one, Rohit Sharma was not picked in the squad, and a case could be made for the team being one batsman short; two, the bowling seemed a bit lightweight going into the tournament with only one experienced spinner.
The then chairman of selectors, Kris Srikkanth, exuded confidence in this team: “Don’t forget that you are playing in India. The spinners probably play a very major role on the turning wickets. I am confident that the kind of balance we have, the kind of batting line-up we have, this team led by Dhoni will do the job for us”. With the World cup being held in the subcontinent, his panel was confident about the part-time options offered by Sehwag, Raina, Yusuf Pathan and Yuvraj.
In the first match, our man Yuvraj Singh didn’t have much to do. Sehwag’s belligerence had put the match out of Bangladesh’s reach, and after safely pouching Tamim Iqbal, he wheeled in his overs. Over the next four matches, he would stroke 3 fifties and nab seven wickets. The doubts still lingered though—the wickets had come against Ireland and Netherlands. How would he hold up against the bigger tests that lay waiting for him deeper in the tournament?
In the remaining four matches, he would chip in with defining contributions in all four. A hundred against West Indies, anchoring a tight chase against the Aussies, and staying on the inevitable victory lap on what was the biggest stage of them all. That was not all; he would take 2 wickets in each of these matches as well. Four Man of the Match awards in a single World Cup (third after Aravinda de Silva and Lance Klusener). 362 runs @90 and 15 wickets @25. Easily the man of the tournament. What made this even more special was that he had produced these performances with the yet-to-be-discovered devil of germ-cell cancer residing inside him. Somehow, this Indian team had held up thanks to the balance brought by this man.
Not bad for a bowler who was derisively labelled as “pie chucker” and “left-arm filth”, eh?
But speaking about his bowling career as a whole, it is fair to say that Yuvraj Singh wasn’t a thoroughbred all-rounder for India in ODIs. While no one doubts his batting pedigree and claims to a spot in the hypothetical all-time India ODI side, he bowled in only ~50% of his matches, averaging slightly over 5 overs per match—with most of his overs being bowled from a position of 6 and above. These statistics would firmly place him in the category of part-time bowler. His overall bowling average isn’t earth shattering stuff (like the 2011 WC stats) as well.
But over the course of the history of the ODI, who were the cricketers that could regularly chip in in both innings? What are some of the characteristics that we can expect out of a “good” ODI all-rounder? Let’s take a detailed look. For the purposes of this article, we will be looking at players who served as true all-rounders—contributing with both bat and ball—thus bringing a multitude of skills and team balance into the mix.
The ODI is different from the test match format in some ways. For starters, each team bats only once. But another crucial difference is the participation of the lower order in batting. While bowlers are expected to bat in tests, given the fact that the average ODI produces ~7 wickets per innings, the all-rounders usually occur a bit higher in the batting order. Additionally, teams tend to pick bits-and-pieces cricketers (like Chris Harris) in ODIs—as opposed to specialist bowlers and batsmen—due to the fact that ODIs can be won by run containment. Therefore, ODI all-rounders are a grade below their test counterparts (like Sobers, Miller, Imran, Botham etc.)—who can command a specialist place for either skill.
Right, it is time for some cutoffs. We’ll be largely looking at all-rounders who featured in 100 batting and bowling innings, bowled in at least 80% of the matches, nabbed 100 wickets, and have an batting minus bowling average of -5 (or better). The criteria will also be relaxed slightly to allow a few exceptions who fell short in 1 or 2 criteria. This exercise gives us our first glimpse of the magnificent dozen: Kallis, Klusener, Flintoff, Watson, Angelo, Kapil, Cairns, Shakib, Imran, Razzaq, Greg Chappell and Symmonds. Unfortunately, we had to leave out several other players such as Viv Richards, the Waughs, Cronje, Hooper, Gayle, Jayasuriya, Harris, Botham and others as they fell short on more counts.
The batting

Real-time variation of batting average with each match
The batting average is often used as a measure of excellence of a batsman. Of the twelve players, five are in the 40s range (Chappell, Kallis, Klusener, Angelo and Watson), followed by Symmonds, Flintoff, Shakib and Imran in the 30s range. Of this lot, only Kapil Dev’s batting average is much lesser than the rest. However, we must also remember that the batting average is dependent on the position at which the batsman batted. Coming in later not only limits the opportunities to bat with more established batsmen, but also robs you of an opportunity to build an innings (and raise his average). Note that these are real-time figures and hence “streakiness” is more common in the early career as the late career deviations are cushioned by the total number of matches. Hence, the real-time data has been shown after 10 data points only (but duly accounted for).

The average batting position (ABaP) is the average of all the batting positions batted at by the respective player, taking into account all the innings he has batted in. A lower number indicates that the batsman has batted mostly higher up the order. Both the opening positions have been given a value of 2 as they are equally spaced from 3 compared to the number 4 batsman. The above table is in line with the relationship between batting position and average; one can see that as players with the highest averages generally have lower career ABaPs, and Kapil’s lower batting average has to be seen in this context. A note of caution though—though ABaP numbers are generally indicative, since it is an average, it can throw up numbers which may not correspond with a player’s most popular position (we’ll see at least one such example shortly).

Batting position distribution for different players
The batting position distribution also roughly follows the ABaP values, showing that ABaP is a good first-cut approximation for the batting opportunities provided to the batsman throughout his career. However, we must also note two glaring exceptions—Watson and Klusener. The former batted mostly in the top order, but his few innings in the lower middle order have dragged his ABaP to ~3.5. The latter is a work of art—he has batted all across the order (most frequently at 8); in spite of this, he managed a batting average north of 40. But how did these players move across the batting order over the course of their careers?

Real-time average batting position variation with each innings
Plotting the real-time variation of the Average batting position is one way to track this movement. And keeping track of this does reveal valuable insight: by and large, players have been steady across the batting order (Flintoff) or have been shifted around a bit (Shakib). Coming to the outliers, Klusener’s real time variation shows a major shuffling around the order before settling in the lower-middle order; Watson, and to a lesser extent Imran, moved higher up the order as their careers progressed.
The bowling
The bowling analogue of the batting average is the bowling average. Like its batting counterpart, it is measured in runs (conceded) per dismissal, albeit with the better players showing lower values. Additionally, the bowling average has information about both the economy rate (runs conceded per over) and the bowling strike rate (balls per wicket). Good bowlers typically have values south of 30.

Real-time bowling average variation with each match
The career progression of bowling average shows major upheaval in the case of Kallis and Watson—they needed in excess of 50 matches to settle close to their end-career levels. Also, barring Symmonds and Razzaq, the players largely became better bowlers as their careers unfolded. Flintoff, Kapil and Imran had the stand-out bowling averages of this pack. But what about its relationship with the bowling order?
The Average Bowling position (ABoP), like its batting counterpart, gives an indication of the most frequent bowling position of the players. Though, it must be noted that the bowling order is a lot more fluid compared to the batting order as bowlers can bowl the early over but then finish their quota only at the very end of the innings. But due to the absence of overall ball-by-ball data throughout the history of the ODI, this is the best information available.

Only Imran and Kapil were frontline fast bowling options. Kallis, like his test role, was largely a support seamer. The ABoP also shows the favoured type of all-rounder in ODIs—the cricketers who can do a bit of batting and some medium pace bowling—and the majority belong to this category. Shakib and Symmonds (who sometimes also bowled medium pace) are the spin bowling all-rounders in this otherwise medium pace-heavy contingent.

Bowling position distribution for each player
The bowling position distribution unearths additional detail to the ABoP data. As explained earlier, all these players bowled in at least 80% of their matches (with Symmonds and Matthews being the least). But Kapil Dev’s frontline status is in a different league—he was the runaway leader of the attack in ~90% of his matches, unlike any other player; perhaps, this explains his lower than expected batting average. The distribution also reveals that there are additional levels to middle over bowlers—Cairns, Flintoff and Razzaq were more preferred earlier than, say, Watson, Klusener or Chappell.
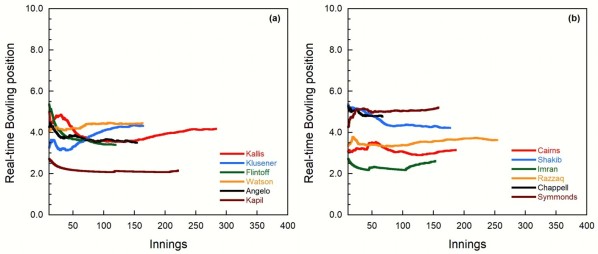
Real-time bowling position variation with each innings
The real-time ABoP shows much lesser movement when compared to the batting order. Then again, it must be remembered that the desired data which would resolve this is missing. From the above charts, it looks like players largely stuck to their respective roles. Although, it must be noted that the South Africans normally bowled alongside Donald and Pollock (as did Watson with Lee and co.), which might somewhat explain their lowly ABoPs.

Real-time overs per match for each player
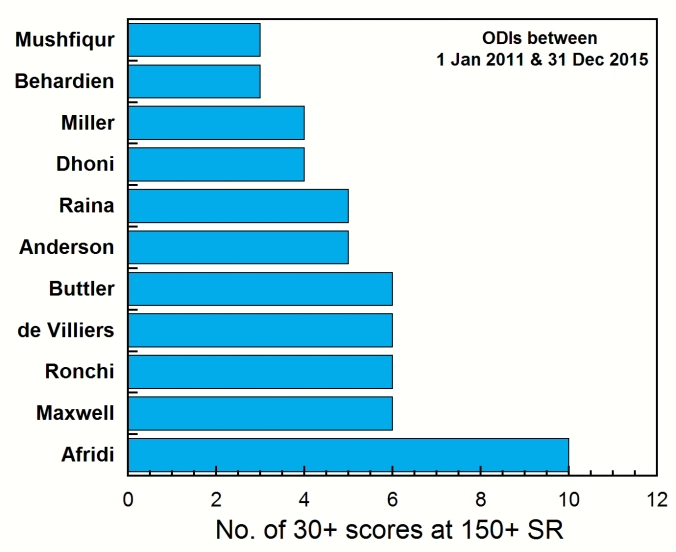
The bowling load shouldered by the players can be gleaned from the overs bowled per match data. Another note of caution here: ODIs, especially from the earlier years, tended to be more than 50 overs long, and players like Imran and Kapil bowled more than 10 overs in many matches. Kapil, Imran, Klusener and Shakib can be classified as full-time bowlers; Kallis and Flintoff took greater bowling responsibilities for some time as their careers progressed; the others mostly hover around 5-6 overs mark, showing that Yuvraj Singh’s 5 OPM is quite reasonable, considering that he bowled in much fewer than 80% of his matches.

Real-time balls per wicket for each player
Another way to spot the wicket taking bowlers is to plot the bowling strike rate (balls per wicket). Of course, in the ODIs the economy rate is also important but this metric does indicate the players who were the better wicket takers among the lot. Cairns and Flintoff were fantastic wicket takers all through their careers (Razzaq in his first 100 matches as well). Also, the improvement shown by Watson, Chappell and Kallis is remarkable.
Tying it all together
Now for the last bit of analysis to look at their all-round contributions. The net contribution of an all-rounder can be measured in terms of the difference in levels of batting and bowling averages. Keeping in mind the importance of the batting position, it can give an indication of the net contribution to the team.

Real-time average difference for each player
Kallis, Klusener, Flintoff, Watson and Imran had a very healthy average difference for large parts of their ODI career. But spare a thought for Greg Chappell—he had spectacular numbers until the fall near the end of his ODI career. In the current lot, Shakib and Angelo Matthews have shown world-class numbers in this respect. Also, it must be noted that almost every player’s values fluctuated wildly in the first 50 matches; perhaps it takes ~50 matches for both sets of statistics to stabilize.

Real-time average ratio for each player
Another, not-so-common way of expressing the same information is to through a ratio of the averages. A ratio yields a dimensionless number, as opposed to the runs/wicket currency of the earlier metric; this latter measure favours the better bowlers due to the bowling average appearing in the denominator. Only Kallis and Klusener come close to the 1.5 mark, although others like Watson, Chappell and Imran have touched it at various points of their career.
The last question left to answer would be the classification of these wonderful multi-skilled men. Is there any easy way to label these players?

Classification of ODI allrounders
One easy way to visualize this data is to plot the ABaP against the ABoP to reveal the buckets which neatly cluster together in recognizable patterns. Using the data from earlier, we can proceed to label them accordingly. In the above plot, the lower right quadrant has top order batsmen who are useful bowling options; the top right quadrant has late order muscle and middle overs specialists; the top left quadrant contains strike bowlers and lower order batsmen. There are three out-of-place players in this above chart—Razzaq faded away as a wicket-taking force towards the end of his career, Angelo Matthews isn’t as much of a regular bowler nowadays, and Shakib is a regular bowler.
But more incredibly, there is no player in the lower left quadrant—a top order batsman and a strike bowler (someone like Neil Johnson, but who had a much longer career). Perhaps, considering the fact that Shakib is a lead bowler for Bangladesh, and a spinner (and hence comes 2 bowlers later), his real position should be in the empty quadrant with an effective bowling position of ~2, which shows his overall stature in the game today. Additionally, he’s easily the game’s best ever spin-bowling all-rounder, and a lone representative in the high table of ODI all-rounders, which has been traditionally dominated by the faster men.
What about the rest of the current crop? Stokes, Pandya, Ali have a long way to go in their young careers; Faulkner needs to find a way to get selected; others like Kane Williamson are more of the batsmen who can bowl well category.
If we had to pick one, and only one, it would have to be a player who didn’t have quite the happy ending to a World tournament à la Yuvraj Singh. Yes, we are talking about Lance Klusener—the tragic hero of the 1999 World Cup. Blessed with belligerent batting to go along with his canny bowling, he would have easily been the top of the money heap in today’s age of franchise T20 competitions.
Disclaimer: An image used in this article is not part of this blog. It has been used for representational purposes only. The copyright, if any, solely rests with the respective holders.


