A World cup squad for the ages

The quadrennial cricketing extravaganza that is the Cricket World Cup begins in less than 48 hours when England take on South Africa. The sports pages of every news publication, online and offline are filled to the brim with stories about the players, squads and unforgettable moments of yesteryear. With excitement building up towards this grand, we decided to throw our hat into the ring with a fun exercise of our own—building a hypothetical all-time XI.

What would serve as a fair selection criteria that can be applied across the board to facilitate such an exercise in fandom? Firstly, only performances from the ODI World Cups will be considered. Secondly, the player should have played in at least 10 World Cup matches and 2 editions; this criteria is to ensure that players with a stellar showing in one tournament (for example, Shikhar Dhawan) don’t necessarily upstage players with longer, more consistent World Cup records. As a consequence of these two criteria, many players with stellar ODI records (thinking of you, Virat Kohli and Joel Garner) unfortunately miss out, but present-day players certainly have a chance to correct this in the future. The squad would nominally have 6 batsmen (2 of whom can serve as the 6th bowler), 1 wicketkeeper-batsman, 4 bowlers and 1 all-rounder but there is scope for some flexibility. With this in place, let us move on to the players themselves.

Wicketkeeper-batsman

Four wicketkeepers have stellar World Cup records: Adam Gilchrist, Kumar Sangakkara, Brendan Taylor, and Brad Haddin. Both Gilchrist and Kumar Sangakkara have had longer and more productive careers compared to the other two—hence it is down to these two. Both are excellent glovemen and hence the debate between the two will come down to batting (see below).

Top order (1-3)

One name automatically makes the list: Sachin Tendulkar. Who can argue with the batting pitamaha’s overall record and a stellar showing in three world cups? The identity of the other two players will no doubt cause much deliberation. Will it be his illustrious batting partner, Sourav Ganguly? Or explosive southpaws such as Adam Gilchrist or Sanath Jayasuriya? We then looked at players who married consistency with strike rate at the top, leading to 4 other contenders—Mark Waugh, Herschelle Gibbs, Matthew Hayden, and Tillakaratne Dilshan. Despite Dilshan’s edge as a part-time bowler, the fact that his best performances came against the “lesser” teams put him out of contention. With little to choose between the other three, we chose Matthew Hayden for his left-handedness and higher strike rate.  For the number 3 slot, Kumar Sangakkara’s consistency was hard to overlook and he easily towers over Ponting, Kallis, and Lara. A case could be made for playing both Gilchrist and Sangakkara but Hayden’s advantage (~+15 average) won the trade-off against Gilchrist’s stats (~+5 strike rate). Besides, we have packed the side with plenty of firepower in the middle order.

Hayden: 22 matches, 987 runs @51.94 avg. and 92.93 SR

Tendulkar: 45 matches, 2278 runs @ 56.95 avg. and 88.98 SR

Sangakkara: 37 matches, 1532 runs @ 56.74 avg. and 86.55 SR, 41 catches and 13 stumpings

Middle order (4-6)

As was the case in the top order, one more name automatically makes the list at number 4: Viv Richards; his handy bowling and fielding complemented his destructive batting well. The following act is a recent-day player who probably was the closest to Richards in his pomp—A B de Villiers. The number 6 and 7 candidates are some of the hardest to fill—is it better to pick someone like Javed Miandad, or Steve Waugh, who can marshal the lower order and bring in the big hits when necessary? Ultimately, we went with flexibility and power as the top 5 have enough batting ability and consistency to stave off even the most hostile bowling attack.

Viv Richards: 23 matches, 1013 runs @ 63.31 avg. and 85.05 SR

A B de Villiers: 23 matches, 1207 runs @ 63.52 avg. and 117.29 SR

All-rounders (6-7)

There are only 4 players under consideration—Imran Khan, Kapil Dev, Yuvraj Singh, and Lance Klusener. Imran Khan has an outstanding bowling record but his batting is less than stellar. Following Viv Richards and A B de Villiers is already a difficult task and his ~66 SR would be out of place, even if it were to be “inflation-adjusted”; Lance Klusener has an amazing batting and bowling record in the World Cups and he would totally fit in in today’s T20-fuelled era; Yuvraj Singh is more a part-time bowler who had one good World Cup bowling-wise. Kapil Dev’s World Cup bowling record is merely “average” by his own lofty standards but his batting takes the cake—who can forget his immortal 175* against Zimbabwe? In the end, it is a very tough call between Kapil Dev and Imran Khan but considering that the top 5 are very consistent, we went with batting power over bowling chops. Kapil, Klusener, Richards, and Tendulkar can more than capably bowl the 5th bowler quota.

Lance Klusener: 14 matches, 372 runs @ 124 avg. and 121. 17 SR; 22 wickets @ 22.13 avg.

Kapil Dev: 26 matches, 669 runs @ 37.16 avg. and 115.14 SR; 28 wickets @ 31.85 avg.

Fast bowlers

For the fast men who will take the new ball, it is hard to look beyond two legends of the game—one known for unerring and nagging consistency, and the other, the sultan of swing. Yes, we are referring to Glenn McGrath and Wasim Akram. Unsurprisingly, they have the highest number of wickets in the World Cups (fast bowlers only). Other capable candidates such as Chaminda Vaas, Zaheer Khan, Lasith Malinga, Brett Lee, and Shane Bond miss out due to the illustrious careers of these two new ball schemers.

Wasim Akram: 38 matches, 55 wickets @ 23.83 avg.

Glenn McGrath: 39 matches, 71 wickets @18.19 avg.

Spinners

Here too, it is difficult to look beyond the two champion spinners of the game—Muttiah Muralitharan and Shane Warne. Though Warne has played only in two World Cups, his overall record pips him to the final bowling slot ahead of Vettori, Hogg, and Kumble.

Muttiah Muralitharan: 40 matches, 68 wickets @ 19.63 avg.

Shane Warne: 17 matches, 32 wickets @ 19.50 avg.


Squad balance and captaincy

Overall, the squad has it all—consistency at the top and middle, explosive power in the middle order, left-right combinations galore, a bowling quiver full of all types of arrows, lower-order batting in Akram and Warne, and even comic value in two genuine number 11s. Who will be the captain? Imran Khan would have been an obvious choice had he made it, but since we’re picking the captain after making the 11, we would pick Kapil Dev. Kapil Dev was even more crucial to India in 1983 than what Imran was to Pakistan in 1992, and he transformed a bunch of no-hopers to world champions against all odds through a mix of self-belief, inspiration, and leading from the front. Imran, on the other hand had an excellent bowling unit and decent batsmen coming up the ranks. For this reason, Kapil paaji da jawaab nahin. The cerebral Sangakkara will serve as his able deputy.

All time World-cup 11: Matthew Hayden, Sachin Tendulkar, Kumar Sangakkara (wk & vc), Viv Richards, AB de Villiers, Lance Klusener, Kapil Dev (c), Wasim Akram, Shane Warne, Muttiah Muralitharn, Glenn McGrath

The bowling avengers: completing the squad

We’re back to the year 2030. As discussed earlier in this series, a mysterious group of aliens have landed on Earth and are interested in facing off against the Earth’s finest in a one day international (ODI) cricket series which will seal the planet’s fate. It has now been six months since the various wise heads of the BCCI put their brains together to come up with a hypothetical batting lineup combed from ODI history to face the alien might.

Meanwhile, the aliens have gotten comfortable on Earth, and are getting to grips with its various quirks as they are going about their daily cricket practice routines. There is a lot of confusion regarding the status of the aliens—whether they are illegal immigrants or refugees—and this is occupying columns of newsprint in the West. Back home in India, the epicenter of all the action, some events are predictable and comforting. The jury is still out on demonetization. Salman Khan is still making movies, and employing a driver in the age of driverless cars. Rahul Gandhi’s latest speech is touted to be his coming-of-age moment.

The aliens are now anxious; it has taken more than six months for the BCCI to come up with half a team. The last table thumping did not have the desired effect or response from the BCCI. On their part, the BCCI are complaining about impending Presidential elections and the saga of various state associations not falling in line. Plus there is the small matter implementing the Supreme Court recommendations.

Furious at the inaction, the aliens issue yet another ultimatum, and decide to go nuclear. No, not by any means of violence; they simply choose to rewrite the various broadcasting, internet, TV and VR rights for the various India home series and the IPL. Suddenly, the BCCI wake up from their slumber and swing into action. They now huddle together in order to complete the lineup with a 15 member squad, of which only the batting lineup have been chosen so far—Tendulkar, Amla, Kohli, Richards, de Villiers, Dhoni and Klusener. This fictitious exercise is a culmination of scouring the history of ODI cricket to identify the players who outperformed their peers.

How do we go about selecting the rest of the team?

The ODI format of cricket has changed its spots over time. In the initial days of the format, teams often treated it as a truncated version of the test match. Besides, teams also had 60 overs to negotiate. With the advent of power-hitting at the start of the ODI in the early ‘90s, the game pivoted to a much more frenzied approach against the new ball. Since then, the economy rates of bowlers have been continuously on the upswing. Plus, we now have a newer format (which rewards power hitting a lot more) to contend with—the T20.

In spite of bowlers receiving a hiding over the last few years of the ODI, the basic resource dynamics of the game hasn’t changed. In the game of cricket, three basic quantities are measured—runs, balls and wickets. Depending on the format of the game, the importance of each quantity (and their interplay) varies. Considering that an ODI can be won by either bowling out the opposition or by run containment, a good bowler needs to be on top of two metrics: one, the bowling average (runs conceded per wicket), and two, the economy rate (runs conceded per over). They are the bowler’s equivalent of batting average and strike rate respectively.

The product of the two (divided by 6)—often called as the Bowling Index (BoI)—has been used by ESPNCricinfo and many others as a tool to benchmark bowlers against their peers. Usually, analysts have compared a bowler’s BoI with the corresponding BoI of the average bowler during the said player’s career—this is a method that has also been used by us in our earlier exercises. This is a solid, first-cut method no doubt, but it has some inherent disadvantages, which will be discussed and addressed shortly.

1.jpg

Table 1: Variation of Bowling Index (first) across the batting order in different time periods

2.jpg

Table 2: Variation of Bowling Index (second) across the batting order in different time periods

Upon detailed examination of the above BoI tables, some characteristics of bowling in ODIs become apparent. One, bowling in the first and second innings are totally different ball games with respect to the BoI; two, bowling at the top of the bowling order is far more advantageous with respect to bowling statistics (and hence encapsulated by the lower values of BoI).

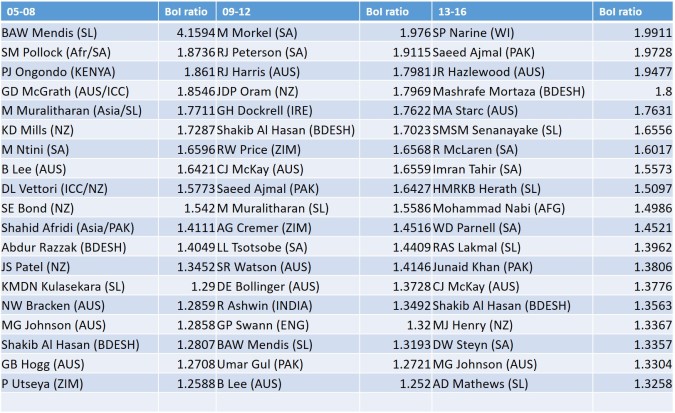
In the previous two articles of our bowling series, the BoI concept was extended in order to examine which bowlers dominated their peers in terms of their performances. We had computed and compared BoI ratios (by dividing the baseline with the BoI of a particular bowler during an era) of various players during the first and second innings of the ODI over the course of the history of the ODI (nine ODI eras in total, each having an excess of 250 matches). A benchmark (BoI ratio of 1.40) was also applied across the board (after an appropriate cutoff, of course) in order to separate the elite performers during a particular era. A BoI ratio of 1.40 represents a 40% higher performance over the average bowler. It must be noted that a BoI ratio of 1.40 is extremely rare, and less than 20 players have achieved it during every era under consideration (all stats until Dec 31, 2016 have been included).

Many bowlers have been able to perform at a very high level in some eras (Ajanta Mendis, for example), but have struggled to replicate it across multiple time periods—except for the very few standout performers who have shone throughout their careers.

Considering that the ODI has undergone a sea of change from its first sighting in 1971, a hypothetical exercise like this raises many questions. How can players from one era be compared with the present day ones? What about players—like Brad Hogg—who have had stop-start careers? Can today’s bowlers, who bowl in such impoverished times, hold a candle to the legends of yesteryear? What about the changing rules of the powerplay, influence of T20 and smaller boundaries? So many issues to resolve.

Therefore, any analysis must take all these valid questions into consideration. Hence, we have to compare bowlers’ tallies with statistics relevant to their own careers. The grandfather of ODI batting, Sachin Tendulkar, played in a record 463 matches. In contrast, the bowler with the maximum appearances in ODIs is Wasim Akram with 356—a full 107 matches lesser than the overall record. On the whole, bowlers have a lesser shelf life, and this must reflect our cutoff as well. If the batsmen had a cutoff of 75 innings at 30 runs per dismissal, the bowlers have to clear the 50 innings, 50 wickets, 2000 balls bowled at 32 runs per dismissal. At the same time, this level is moderate enough not to exclude the modern outliers. This brings a total of 132 players under the lens.

The criteria for selection would be excellence over a sustained period of ODI cricket (interested readers can go through the era-specific values in the earlier articles), unless the gulf between the BoI ratios of a bowler with a short career and a long one is hard to overlook. Considering that many present day players may not have played in as many matches, the ones who could perhaps surpass the legends (in terms of BoI ratio values) in the future will be mentioned in the special mention category. Next comes the algorithm for selection.

3.jpg

Table 3: Variation of BoI (second) (%) using BoI (first) as a reference. Eg. BoI (second) is % higher for 1&2 compared to BI (first) between 71-84. (BoI (second)-BoI (first) /BoI (first))*100

Upon detailed examination of the above BoI tables obtained from the first two parts of the bowling exercise, it becomes clear that this method does not take three crucial factors that affect BoI values into consideration. One is the first to second innings disparity; second is the bowling order; third is the era centric values. To some extent, a uniform baseline takes care of the third factor, but the first two lie unaddressed. Considering that the spinners have struggled to match BoI values of fast bowlers, a tweak has to be applied to make sure there is decent representation across the board. This tweak has to be based on the bowling opportunities that was provided to the bowler during his career (until 31 Dec 2016).

Are there other concepts that we could use? The Average bowling position (ABoP) is a composite number representing the mean of all the bowling positions bowled in by a particular player. While the ABoP itself cannot reveal all information (as similar magnitudes of ABoP can be obtained by differing combinations of bowling position distributions), it can give us a snapshot of a bowler’s most usual bowling position in the bowling order.

Additionally, readers must also keep in mind that the bowling order is a lot more fluid compared to the batting order. For example, it can be said with a large degree of confidence that the openers are still at the crease at when the batting team have lost no wickets (barring rare cases of a batsman retiring hurt). However, a bowler can open the bowling, bowl the solitary over, and then complete his quota at the death; but the scorecard will still list his bowling position as 1. See the problem? Unfortunately, ball by ball data is not available for matches before 2001, and hence we will have to resort to the bowling order.

Using the same principle of the ABoP, the fraction of innings bowled in the first/second innings, in different bowling positions and in different time periods will be multiplied with the respective BoI values of all bowlers who bowled in similar circumstances (tables 1 and 2), which is then summed up to get the bowler’s BoI baseline (weighted) for that particular player. In some way, with this tweak, we will be comparing the said player’s BoI with a hypothetical, composite, average bowler—who has been afforded similar bowling opportunities (first/second innings, bowling position and era) during the player’s career.

Now that we have nailed down the algorithm for selection, we can move on to the selection of the players.

The bowling lineup should contain fantastic strike bowlers, with the inclusions for variety and part-time options as well. Considering that the batting lineup had Tendulkar and Richards, they can be expected to fill in the sixth bowler’s role in case one of the five receive a hiding from the aliens. The fifth bowler should ideally be an all-rounder who can bowl their full quota of overs (pace or spin) and is a competent batsman, in order to lend balance to the team. The batting exercise selected seven players (one batting all-rounder, one keeper and two sixth bowlers). In the remaining eight places, we can thus select three pacers, two all-rounders, two spinners and a spare player. Additionally, a left-arm pacer and a wrist spinner would be nice as well in the interest of variety.
4.jpg

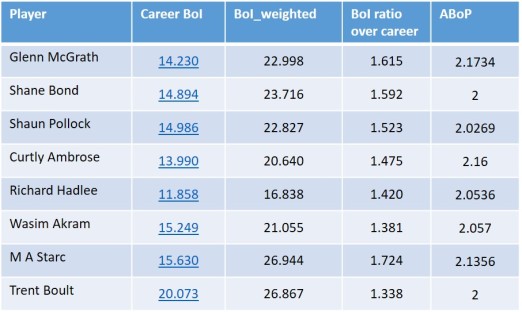
The metronome Glenn McGrath will be opening the bowling for the earthlings (note that players bowling at position 1 and 2 have been allocated a bowling position of 2). His BoI ratio stands apart compared to other opening bowlers such as Bond, Pollock, Ambrose and Hadlee. At the other end, Wasim Akram would be steaming in with his left arm swingers. Readers must note that in his young, 59 match career (until 2016), Mitchell Starc has racked up some ridiculous numbers. Considering that he has had a stellar 2017 as well, it might be wise to succumb to temptation and select him instead. Though, does Akram’s excellence at the death and the many headlining moments over 356 matches shade the younger man’s career so far? Really tough call.

5.jpg

In the first change position is the all-time BoI ratio leader—Joel Garner. The extent to which the man towered over the rest (both literally and figuratively) can be gauged by the fact that no one else got close within ~8% of his career BoI ratio. Other fast bowlers (with illustrious colleagues) like Holding, Donald and Morkel also have excellent values in spite of bowling at no. 3. Perhaps, in any other team, they might have opened the bowling.

6.jpg

In the earlier method of comparing the player’s BoI with a flat baseline, spinners had poor representation. However, with this new method in place, their numbers are quite impressive in the overall scheme of things. Leading the tweakers’ pack is Saeed Ajmal, but given his history with his bowling action, Muralitharan will be chosen lead spinner. Saqlain Mushtaq is not far behind as well. In the case of wrist spinners, Imran Tahir (62 matches) has clearly outperformed his peers but would he walk into the side ahead of Shane Warne (194 matches)? Yet another case of Starc vs Akram.

7.jpg

What about the multi-taskers? Though part-timers like Allan Border and Darren Lehmann have great statistics (Lehmann doesn’t clear the 2000 ball cutoff), their ABoPs is close to six and hence they were only capable sixth bowlers—clearly not good enough to merit selection. In our team, all-rounders with more credible bowling abilities have been chosen.

8.jpg

Andrew Flintoff takes the pride of place amongst the bowling all-rounder pack—his batting numbers are pretty good as well. Klusener, Watson, Imran Khan, Kallis and Kapil Dev were better than their weighted baselines over their careers as well. Among the spin bowling all-rounders, Shakib Al Hasan is the undisputed leader with impressive bowling numbers; that he’s been able to post such statistics despite hailing from a weaker team is indeed commendable; him being a left-arm spinner adds to the variety as well. The presence of all-rounders adds a lot of depth to the team—the overall sum of the batting index (BI) ratio and bowling index (BoI) ratio gives an indication of their average contribution per match compared to the average batsman/bowler. Klusener is the overall leader due to his batting tilt; Flintoff and Shakib are very capable bowlers and they complete our set.

All that is left is the identity of the 15th player.

Is there enough cover for the pacers with only 3 frontline quicks? Should it be Holding, a pure pacer, or someone like Pollock who has a near-identical BoI ratio but can bat really well? Considering Flintoff is a super bowler in his own right, another pacer seems excessive. What about bolstering the middle order? Where is the left handed batsman? How can someone like Bevan or Hussey miss out with such high BI ratios? Not that it is any consolation, but Shakib Al Hasan is a decent batsman (though not in the same class); also—though he might not like it—Sachin Tendulkar could perhaps be persuaded to bat in the middle order if push came to shove. Shane Watson could also be considered as a batting pick due to his flexibility, but he wouldn’t displace any batsman on batting merit.

Considering all this, our BCCI’s last pick would be the left handed Adam Gilchrist—with a BI ratio better than Hayden (and close enough to the right handed Greenidge and Sehwag). What tipped the scales in his favour was his handedness, firepower (which could perhaps be deployed in the lower order as well) and his keeping ability. Yes I do hear that AB de Villiers has kept wicket in ~28% of his matches, but we wouldn’t want to burden the star batsman with additional responsibility given that the fate of the earth is at stake, would we?

This team has it all—thrilling openers, chase-meisters, finishers par extraordinaire, red-hot pacers, cunning spinners and multi-taskers supreme. Regardless of the nature of the pitch and the opposition, this squad should find the relevant answers; though, if the otherworldly beings turn out to be multi-limbed, irregular-formed, squiggly beings, I suspect the issue of handedness and leg before wicket will cause much consternation in the commentary box. The uber-cool, unflappable Dhoni would be captain of the side.

Bring on the aliens.

World XV: Tendulkar, Amla, Gilchrist, Kohli, Richards, de Villiers, Dhoni (c & wk), Shakib, Klusener, Flintoff, Warne, Murali, Akram, McGrath, Garner

Honourable mentions who could make it to the team in the future if they continue to perform at similar levels for a few more years: Buttler, Starc, Tahir


The terminators

Which is the unluckiest team in sport?

In the 2016 World Series, the Chicago Cubs beat the Cleveland Indians in the 112th edition of the Major League Baseball’s championship series. Until then, the Chicago Cubs, incredibly, had not won this championship for a record 108 years. The 2016 appearance in the World Series was their eleventh; they had lost their last 8 summit series in over a century. “Lovable losers”, they were called; always a bridesmaid, never the bride—in other words.

The same undesirable epithet could be applied to the Netherlands national football team. Thrice they made it to the finals, but to this day, they have never lifted the men’s World cup. In club football, Germany’s Bayer Leverkusen (dubbed “Neverkusen”) certainly made a good case for themselves around the turn of the millennium with four second place finishes from 1997 to 2002. Particularly, in 2002, the team lost in the finals of the DFB-Pokal and the UEFA Champions League, and surrendered a five point lead atop the league table in the last 3 matches. Spare a thought for Leverkusen’s star midfielder Michael Ballack who would get another loser’s medal—his German teammates would lose the World Cup final as well (he missed the final due to suspension).

So near, yet so far, yet again: The England team at the 1992 World Cup final. Image source: 1.

In ODI cricket, this dubious distinction belongs to England. Thrice they made the ODI World Cup final, only to lose it all the three times. To date, England have not won the prized 50 over trophy (it won the World T20 in 2010). I the first loss they were never in the hunt against a champion West Indies team. The other two losses must have certainly rankled; they were the best chasing team between 1987 and 1992 (South Africa had only played a few matches) and yet managed to lose both these chases. The first one could be attributed to Mike Gatting’s infamous reverse sweep, but what happened against Pakistan? What did the numbers have to say, in the manner of the best players and teams with the ball in the first innings of the ODI?

As investigated in the previous articles of this nature, ODIs can be split into 9 convenient eras—each containing at least 250 matches and one major ICC tournament—with the last one ending by 2016. Over the course of these nine eras, different factors and rulings have provided a shot in the arm for different protagonists of a cricket team. The blazing away in the powerplay was first demonstrated by Martin Crowe and team, in rather thrilling fashion, in the 1992 World Cup. The exploitation milking of the bowlers in the middle to end overs was taken to an extreme in recent times with A B deVilliers as the headline act (stroking a 44 ball 149 in the 2015 World Cup), prompting the ICC to change the powerplay regulations once again. The previous throw of the powerplay dice—along with two new balls and flat pitches—have now given a shot in the arm to the wrist spinners. Hence, a detailed appraisal of the data is necessary to understand the evolution of bowling second in the ODI game through the course of its history.

1a

Ranges of individual wicket hauls and run tallies in an ODI innings of approximately equivalent frequency distribution

As explained in the previous article, bowling differs from batting in many aspects. For starters, specialist batsmen are not usually called in to bowl, and a bowler can be called into bowl at any time in the innings provided he/she has overs left in their quota; wickets are also relatively finite compared to runs. Based on the comparision of frequency distribution of wicket hauls and run-scoring patterns, a four wicket haul could perhaps be compared to the bowler’s equivalent of hundred runs and a three wicket haul being the analogue of an individual score of fifty.

In a one-day international (and T20 as well), matches can be won by either run containment or bowling out the opposition. As an aside, one could mischievously suggest bean counters playing a part in the case of rain-affected games, but we’re only talking about the on-field factors. Therefore, the ability to take wickets and/or the ability to prevent the opposition from scoring runs are of paramount importance in the limited formats of the game. Of particular interest are the economy rate (runs per six balls), big haul percentage (% of innings with more than 3 wicket hauls) and bumper haul percentage (% of innings with 4 or more wicket hauls). Since information from ball-by-ball outcomes is not available for all ODIs, the analysis will be limited to information which can be gleaned from scorecards. Like last time, we will proceed to examine the trends in these factors before moving on to take a look at bowlers who were proficient in the second innings of the ODI.

1b_ER.JPG

Variation of economy rate with bowling order at different time periods (data for second innings only)

The strategy to bowl in an ODI varies between the first innings to the second. In the former, the focus is on limiting the opponent to the lowest score possible whereas the second one has a specific target score in mind (getting them all out is common to both). The variation of the economy rate showcases the evolution of the ODI in general; the opening bowlers were played with utmost caution in the first two eras. The economy rate of the opening strike bowlers has seen a steady upward trend ever since 1993; in recent times, their economy rates have been worse off compared to the later regular bowlers. The specialist spinner (or more accurately, the no. 5 bowler) suffered in the earlier days of the ODI; today, their ER is in line with the opening bowlers. The part time bowlers have predictably suffered a lot more than their regular counterparts, especially in the previous era.

2_3+ haul.JPG

Variation of Big haul% with bowling order at different time periods (data for second innings only).

The propensity to rack up a haul of 3 or more wickets has been relatively in the same ballpark for regular bowlers through the course of history of the ODI second innings. The opening, no.3 and no.5 bowlers have traded positions with each other during the various eras, with the recent eras being the most favourable to the opening bowlers. Oddly, the sixth era (02-04) saw the no. 7 bowler being as effective as the regular bowlers. While this may have been a statistical quirk, it might also be due to the targetting of the part-time bowlers by the opposition batsmen (and getting out).

3_4+ haul.JPG

Variation of Bumper haul% with bowling order at different time periods (data for second innings only).

Examining the trend of picking up four or more wickets shows a variance across the bowling order. The opening bowling slots were not the best place to pick up a bumper haul in the old days of the ODI; the number 3 bowler was the most successful in the first few eras. Probably, the batsmen had a habit of seeing off the new ball bowlers and then taking the first change bowler head on. In the last two eras, the rate of taking bumper hauls is indistinguishable between the first three bowlers in the bowling order. Here too, the part time bowler (no. 6) was as productive as the others during one era.

The overall metamorphosis of ODI bowling in the second innings can be captured by the metric of Bowling Index (BoI). For the uninitiated reader, it is the product of the bowling average and the economy rate divided by 6. For a bowler, both of these are highly valued (lesser the value, the better). Since the BoI is a multiplication product, a low value would indicate a low value of its constituent factors. This metric has been used at ESPNcricinfo, and by other analysts as well.

4_BoI.jpg

Variation of Bowling Index (second) across the batting order in different time periods.

Eyeballing the values of BoI during the different time periods of ODI history, it can be seen that the game has changed significantly from the initial days. The opening position has largely been the best place to bowl throughout ODI history; nowadays, with two new balls, the opening bowlers have posted better figures compared to the previous era. The spin bowlers (Nos.4 and 5) have typically struggled amongst the regular bowlers and the first change bowler has BoI values somewhere in between. The part-timers have been mainly cannon fodder except for around the turn of the millennium when they boasted very good BoI values. Once again, it must be reiterated that the bowling position information is not as reliable as the batting position; but in the absence of ball by ball data across all ODIs, this is the best available measure.

5_BoI percentage change.jpg

%Variation of BoI (second) with BoI (first) as a reference. The positive and negative values have been coloured in green and red respectively.

One of the easiest ways to understand the differences between bowling in the first innings and bowling in the second innings would be to compare the BoIs between the two. The above table shows the variation of the BoI (second innings) with respect to the BoI (first innings). For the benefit of easier reader visualization, the positive and negative values have been coloured in green and red respectively. For example, BoI (second innings) was ~20% higher than BoI (first innings) for opening bowlers in the first ODI era. Since a higher BoI implies an inferior product of bowling average and economy rate, a positive difference (green) indicates that it was easier to bowl in the first innings. However, across the board, it can be seen that it has been generally easier to bowl in the second innings compared to the first (due to the overwhelming number of red/negative values).

Like the previous articles, the overall BoI (across bowling positions 1 to 7) will be used as a baseline for each era. This may no doubt cause some under-representation of bowlers who bowled later on (especially spinners), but this is a good first-cut method in itself. In order to make the selection process more robust, a healthy wicket cutoff has to be applied keeping in mind the typical number of ODIs played by bowlers in each time period. A cutoff is necessary to weed out statistical quirks (eg. Sunil Gavaskar had an ODI bowling average of 25), but at the same time it should not be unusually high to limit the playing field and eliminate a deserving bowler. As the ODI format gained popularity only in the 1980s, lower cutoffs should be imposed on bowlers from the first two eras. Therefore, the cutoff for the first two eras has been kept at 20 wickets, and for the subsequent time periods, it has been raised to 25 wickets. Now that the cutoffs and baselines are in place, we can proceed to take a look at the champion bowlers in the second innings of the ODIs across ODI history.

6.jpg

Bowlers with best BoI ratios (second innings) in the first 3 ODI eras.

In the first three time periods, the West Indian bowlers dominated the second innings ODI bowling charts. Apart from the usual suspects of Garner, Holding, Roberts and Marshall, Patrick Patterson and Winston Benjamin also came to the fore. Other legends such as Imran Khan, Wasim Akram, Kapil Dev, Dennis Lillee, Richard Hadlee also feature in this lists, which shows the similarity of test match bowling and opening bowling in ODIs back in the day. Barring Abdul Qadir, spinners largely had a tough time during the early eras.

7.jpg

Bowlers with best BoI ratios (second innings) in the middle 3 ODI eras.

In the post-“opener enlightenment” period of the ODI, fast bowlers from Pakistan, Australia and South Africa excelled in the middle 3 eras. All-time great ODI bowlers such as McGrath, Pollock, Donald, Akram, Murali, Warne, Waqar and co. made their presence felt with their deeds on the field. Many spin bowlers featured frequently in the tables signifying a revival of spin bowling. More importantly, Muralitharan topped the BoI ratio charts in two successive eras with BoI ratio values in excess of 2.5 which is all the more significant considering that he was a spinner.

8.jpg

Bowlers with best BoI ratios (second innings) in the last 3 ODI eras.

The highest BoI (second innings) ratio was achieved by Sri Lankan mystery spinner Ajanta Mendis in the seventh era, but he hasn’t been able to replicate his form ever since. The last three eras have also seen the emergence of several ODI specialists such as Kyle Mills, Sunil Narine, Jacob Oram and others. Several players from the “minnows” have also made it to the list. The last statement is not intended as faint praise—it is commendable that they still managed to dominate their counterparts with the limited opportunities afforded to them. Several spinners (many of the “mystery” variety) have also done well recently.

Barring the freakish BoI ratio values of Muralitharan and Mendis, the rest of the top bowlers of each era had BoI values less than 2.5. Additionally, the distribution of BoI ratios has been different across time as well. Some eras have been dominated by bowlers, whereas, in some others they have struggled to scale BoI heights. Therefore, a BoI ratio cutoff of 1.40 (like the batsmen) can be used to separate the bowling champions from the “merely good”. The choice of 1.40 is quite deliberate as only handful of bowlers have breached this level in each era. The 1.40 level represents a 40% better performance (in terms of BoI ratio) with respect to the average bowler (bowling positions 1-7) of the particular era. What about the longevity of these bowling champions?

9.jpg

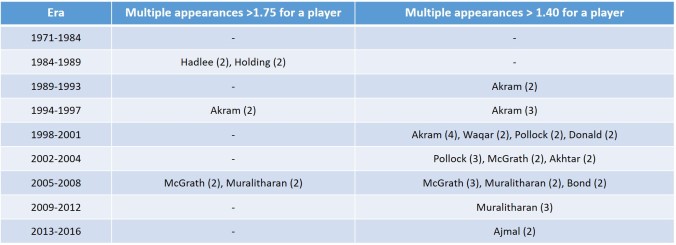
Players having a high level of BI (1.75 or 1.40) across multiple eras.

Very few bowlers have been able to consistently outperform the field in the second innings of the ODI for a long period; almost every bowler in the above table can be considered to be an all-time great. The degree of longevity and excellence of these bowlers can be captured by counting the number of multiple appearances at a particular BoI ratio level. In the above tables, the bowler’s name and his nth appearance (in brackets) at 1.75 and 1.40 BoI levels have been documented.

For instance, Richard Hadlee made his second appearance in the 1.75 level in era 2 (bowling second). Apart from Hadlee, only Holding, Akram, McGrath and Muralitharan have been able to scale such heights (>1.75) in more than one era. The 1.40 level has been breached by several other fantastic bowlers—Pollock, McGrath and the rest. Several other bowlers such as Saqlain Mushtaq, Brett Lee, Ntini, Vettori, Shakib and others narrowly missed making the cut narrowly. Compared to the batsmen, it has been a lot tougher for bowlers to perform at high BoI levels for multiple levels; no doubt, they are less favoured by the ODI format compared to the batsmen.

Now to the teams which had these bowlers. At any point of time, did a team have a battery of these match-winning bowlers in the second innings of the ODI?

10

The countries with the most number of good second innings bowlers (BoI ratio>1.40) in each ODI era.

Taking all eras into account, between five to thirteen bowlers were able to clock a BoI ratio of more than 1.40, showing the exclusivity of the benchmark. Barring two eras, one single team had the highest stockpile of champion bowlers in the second innings of the ODI. Overall, teams from Pakistan, South Africa, Australia and West Indies were blessed with bowling personnel who outperformed their peers in more than one era.  The champion second innings bowler is probably Wasim Akram who spent four ODI eras in the BoI ratio>1.40 bracket (2 of them >1.75). Quite simply, there wasn’t another ODI bowler who dominated the second innings for as long as Akram did—which brings us to the 1992 World cup final.

The 1992 World cup final was contested between arguably the best ODI side of the time (definitely the best chasing side) and a resurgent Pakistan. Pakistan had barely scraped through the group stages courtesy of a rained out match against the very same England side after being all out for 74 (which would have knocked them out). Nearly at the brink and facing elimination, the Pakistan team rallied around a mythical Imran Khan speech, where the team embraced the spirit of a “cornered tiger”. After beating the fancied New Zealand twice, the team booked a spot in the final.

In the final against England in front of a record crowd at the MCG, the Pakistan team posted 249/6 in the first innings thanks to late flourishes from Inzamam and Akram. Akram would then star with the ball as well; after prising out Ian Botham out early, he would be called into service again in the 35th over. After being at a perilious 69/4, England’s two champion chasers—Allan Lamb and Neil Fairbrother—would add 72 runs in 14 overs, setting up the match for a thrilling finish. Who would give way? The unstoppable force or the immovable objects?

Death rattle: Wasim Akram exults after castling Chris Lewis. Image source: 2.

What happened next is part of cricketing folklore. The force was certainly with Wasim Akram. Bowling around the wicket with the old ball under lights, Wasim Akram would conjure two unplayable deliveries, courtesy some hostile reverse swing at extreme pace. The first one would swing in and straighten just a touch to beat Allan Lamb’s stroke. The second one was even more emphatic—poor Chris Lewis has no chance when he brought his bat down to a vicious inswinger which snaked its way to the stumps. The sullen, yellow duck television graphic accompanying Lewis’ walk back to the pavilion signalled how the situation had changed; the chase has been snuffed out in a matter of two deliveries. Wasim Akram running across the pitch with his forearms raised in celebration is one of the indelible images of the World Cup history. A champion bowler had stopped chase-masters England in their tracks, and consigned them to the bridesmaid spot for the third time in five world cups.

Disclaimer: Some images used in this article are not property of this blog. They have been used for representational purposes only. The copyright, if any, rests with the respective owners.