Meet the press: Dhoni answering questions in the captains’ press conference of WC2011. Image source:1.
“Till the full stop doesn’t come the sentence is not complete”
On the eve of the 2011 World Cup final against Sri Lanka, on April fool’s day, M S Dhoni metaphorically suggested that there was more to come from his team. Or did he? Was he prophetically implying the possibility of a thrilling punchline at the end of a half-completed quip, which promised much more than what had been the Indian World Cup campaign so far? Could he have been referring to his own personal form in the lead-up to this match – 20 innings at 26, strike rate of ~65 with no notable contribution in the World Cup?
He could have spouted the clichéd “Its not over until its over” to go along with his usual “Controlling the controllables” and “Bowling in the right areas”, but he didn’t. This quote, in cognisance of what unfolded in the chasi, typified the myth of Dhoni – India’s best chaser at the time. Along with the prescient (and apocryphal) “You just dropped the World cup”, it is one of the finest quotes with a sense of the cricketing occasion. For India, it was a tryst with destiny.
Every cricket fan, who’s watched the game for a while, inherently understands what a crunch situation is in an ODI chase. I’m talking about the moment where the game lies in the balance, and can pivot to another direction at a moment’s notice. Often, our perception of players and the labels we bestow upon them is coloured by their performance in a handful of matches. Is there an objective way to measure a player’s ability to chase?
Any player, who is grappling with a chase, has to deal with two types of problems. One, the player is limited to the situation that he is dealt with, in terms of team support. There is nothing a batsman can do apart from getting on with his business after the bowlers have conceded 300+ or if his side have collapsed to 20 for 3. This is especially compounded lower down the order as there are lesser assurances of batting ability with each dismissal. Two, the player is also limited by the number of balls remaining in order to achieve the target, often under pressure.
Every ODI batsman worth his salt must boast of several skills, ready to be deployed at a moment’s notice – may it be biding his time and seeing off the strike bowler; deftly rotating strike and keep motoring along; or partaking in a final flourish with the target in sight. All things considered, who were the best ODI batsmen in the chase? Richards? Miandad? Bevan? Kohli?
But can the ODI of today be considered in the same breath as ODIs from 30 years ago? Before the format became the primary breadwinner for cricket boards, it underwent a myriad of changes. For starters, it hadn’t made up its mind about the duration of the match, coloured clothing, third umpire, choice of lighting, fielding restrictions, resolution of weather affected matches or the colour of the ball(s). As a consequence of some of these factors, statistics from yesteryear would differ from the corresponding data from today (we’ll see more about this shortly). Hence, it is important to examine traditional cricketing ODI records in history’s context – as the ODI format evolved – before proceeding to look at individual records.
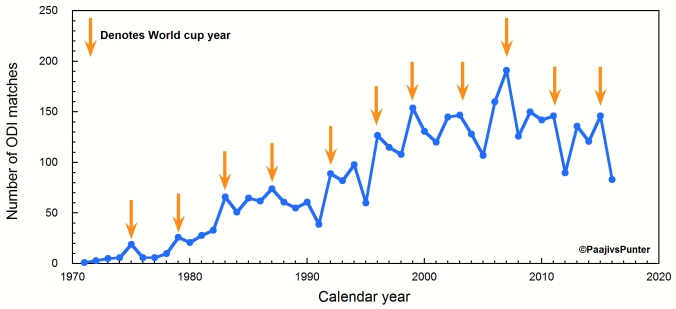
The number of ODI matches has varied widely from the 1 match (in 1971) to an all-time high of 191 (in 2007). Over the years, the number of matches has increased steadily, before declining post-2007 (after the first World T20); every world cup year has hosted more ODIs than its neighbours.
In the first few non-world cup years of the format, only a handful of matches were played which shows that these matches were not taken seriously, and were mostly an afterthought during the test tour. In such cases of wide disparity, how do we compartmentalize different eras? Fortunately, the World cup can be used as a starting point here.
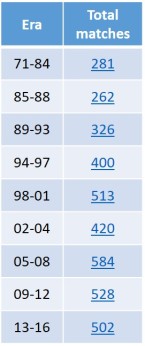
Defining era: Each time period has at least 250 matches.
Partitioning ODIs into 9 different eras in this manner gives us a sufficient number of ODIs to play with; all eras have an excess of 250 ODIs – large enough to make up for one-off statistical oddities. Of particular interest would be the 1989-1993 era, which contained the 1992 World Cup: where Martin Crowe and his nuclear weapon – Mark Greatbatch – challenged prevailing ODI wisdom of opening in the ODIs.
Suddenly, openers around the world woke up from their slumber and were now awake to new possibilities. No more pinch hitter business – everyone had to hit, and not just in a pinch. Each nation had to develop nuclear weapons of their own and a credible second strike capability. Jayasuriya, Tendulkar, Waugh and Anwar were the ones who first sought the slipstream. How did all this affect ODI stats?
In general, batting positions 1-4 are the best place to bat in ODIs; looking at the stats, the players get to play >40 balls/ dismissal, ~20% of the innings result in a big score (50s and 100s) and over 2% of the innings result in 100s. In an ODI chase, the match is deemed to be won after the total is overhauled (duh!), for the loss of less than 10 wickets. Hence, one can envisage some key factors influencing a chase: how fast a batsman scored his runs (strike rate), his propensity to stay not-out, and the ability to rack up big scores. Therefore, we will be examining Strike Rate (runs/100 balls), Not Out% (% of innings not being dismissed), Big score% (% of scores over 50), and 100% (% of innings resulting in a 100).
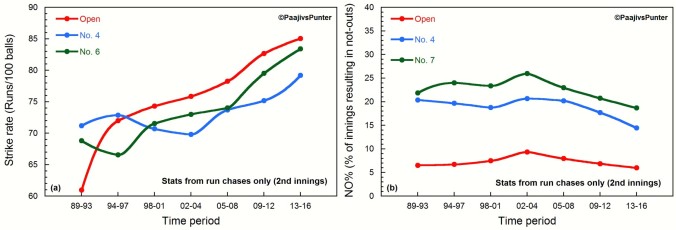
Staying power: The variation of strike rate and not out% across eras
The biggest change in batting at the top of the order happened after the 1992 World cup due to Greatbatch’s pyrotechnics; the strike rate has been steadily climbing ever since, more so at the opening positions. Even lower down the order, strike rates have increased from their earlier levels. Nowadays, the best place to score fast is in the opening slot, unlike 25 years ago – when seeing off the new ball was the openers’ primary responsibility.
Correspondingly, the Not Out% has changed a bit over the years, albeit at much smaller levels compared to the strike rate. The possibility of staying not-out for an opening batsman is pretty slim (~1 in 14 innings). Batting down the order in a chase increases the odds to ~1 in 8 innings for No.3 and ~1 in 5 innings from No.4 onwards. Here too, scoring faster has reduced the frequency of batsmen staying not out across the board, after 2004. What about the big scores then?

Striking it big: Incidence of big scores in different eras, across the batting order.
From the above graph, it can be seen that the chances of making a big score while chasing is quite slim coming in at number 6. On the other hand, batsmen higher up the order have scored big (50 or more) approximately once in five chases. One can also observe a recent glut of batsmen between 1 & 4 scoring hundreds. While there were minor fluctuations before the turn of the millennium, it has been an uphill battle to contain these top order bats five years since.
The correlation between scoring fast in a chase and giving a greater opportunity for batsmen to score 100s is also easily seen in the above plots. Even though the Big Score% is relatively flat, scoring faster in a chase recently has meant that batsmen at the top of the order have been able to convert their 50s to 100s far more frequently. Gavaskar would have given his approval.
Armed with this knowledge, which metric can be applied as a benchmark of batting ability in a chase? All things considered, two numbers matter more than most – the runs per dismissal (batting average, or BA in short), and the strike rate. The product of the two divided by 100, called the Batting Index (BI), can be used as the benchmark of choice. Since it is a multiplication product, a high BI value implies that the constituent factors of BA and SR are high as well.

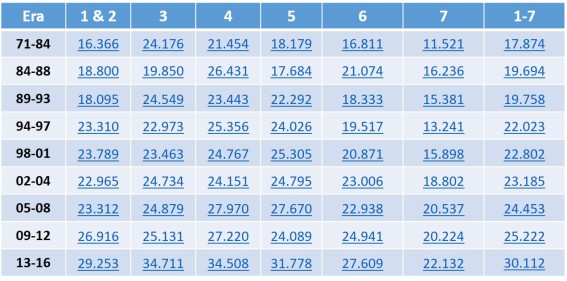
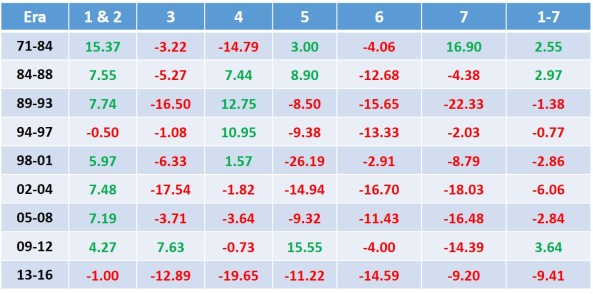
Setting a benchmark: Variation of BI across the batting order, in different eras.
The table containing BI data (chases only) from all eras across the batting order reveals some important insight as well. The BI for openers was quite stagnant until era 4, after which it took an upward turn to lead in magnitude by era 5, only ceding the top position to the number 3 in the latest era. Till then, batsmen batting at 3 & 4 had the best values for BI.
The BI values after the number 5 position have traditionally tailed off quite drastically in a chase; of late, the lower order batsmen have reaped the benefits of the top order batting more aggressively. However, in the latest 3 eras, the BI is quite flat for the top 5 batsmen across the batting order.
For the purposes of this analysis, the overall BI (batting positions 1 to 7) has been taken as the baseline. This may cause an under-representation of batsmen from number 6 and 7, since their chasing BI is not in the same league as the top 5. However, a universal baseline is much easier to apply across the board and hence will be used in this article.
The next step would be to create appropriate cutoffs – we wouldn’t want a player who managed to get great numbers in 4 matches of an era (case in point: Google Andy Ganteaume), and be hailed as the best ODI chaser, would we? One of the easy ways to do that is to impose a minimum run cutoff for batsmen who batted in positions between 1-7 at different eras.
Since the total number of matches started taking off only after the late 1980s, we could use a bar of 500 runs before era 3, and 750 runs for all eras post 1988. This minimum run cutoff would ensure that each batsman chased in at least 10+ innings during the respective eras. Once the selection criteria is clear, we can now find out the 20 batsmen with the best BI ratios (w.r.t to the 1-7 BI baselines) in different eras.
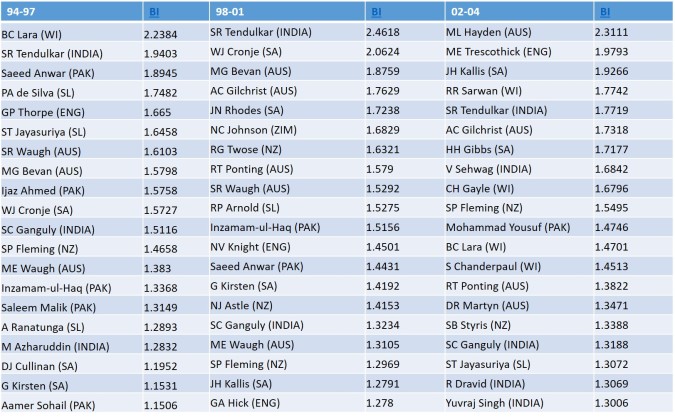
In the first two eras, Vivian Richards was the undisputable ace of the chase. The dominance of the West Indian team is quite clear from the above table – Lloyd, Haynes and Greenidge also feature; other ODI chase kings like Miandad, Chappell, Jones, Vengsarkar, and Lamb make up the list. Kapil Dev’s great BI ratio is of remarkable, considering his low batting position.
Around the time the ODI blueprint was being taken apart by Greatbatch, his captain Martin Crowe was in a rich vein of chasing form. Other top chasers in this period included Azhar, Lara, Ranatunga and two Pakistanis.
In the post-enlightened opener era after the 1992 World cup, a new breed of top-3 batsmen started to boss the chase: Lara, Tendulkar, Gilchrist, Hayden, Ponting, Trescothick, Gibbs, Sehwag and Gayle. Middle order regulars such as Bevan, de Silva, Steve Waugh, Sarwan and Cronje complete the round-up of batsmen who had credible BI ratio numbers from eras 4-6. Zimbabwe’s Neil Johnson is a surprise entry around the turn of the millennium.
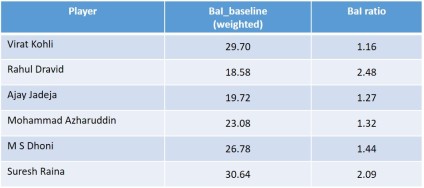
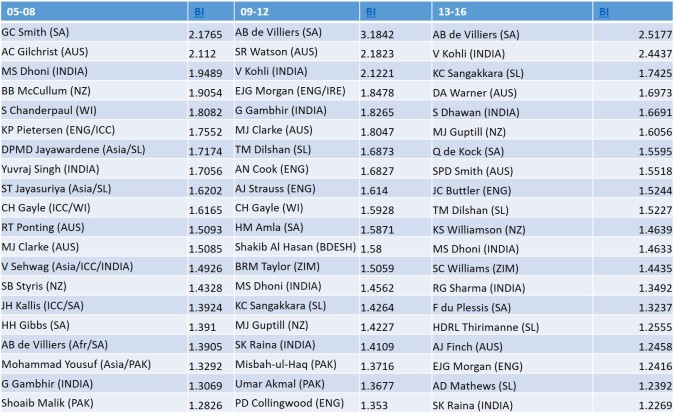
In the last three eras, the middle order batsmen have stormed up the table with a vengeance – Dhoni, AB de Villiers, Kohli, Eoin Morgan, Yuvraj Singh have racked up some stellar numbers. Credit must also go to Jayasuriya for making a reappearance in the top 10 after nearly 10 years.
From the above tables, it can be said that AB de Villiers’ Era 8 chasing BI ratio is the highest, with Tendulkar’s Era 5 a notch below; some great batsmen also hover above the 2.00 mark. It must also be noted that the top 10 chasers didn’t necessarily inhabit the same spread of BI ratio across eras. For example, in Era 3, the top 10 ranged from ~1.9 to ~1.3, whereas in the latest era, the top-10 chasers are spread across ~1.5 to ~2.5.
In order to correct for this, a BI ratio cutoff of 1.40 can be applied to get an elite list of batsmen. The 1.40 benchmark was specifically chosen as at least 9 players have surpassed it in each era. This ratio represents a 40% better chasing performance compared to the baseline during the era.
So how long did these players dominate the rest of the field?
Only a handful of players have been able to outperform the baseline consistently in more than one era; the sheer paucity of multiple appearances shows how difficult it is to maintain chasing excellence in ODIs across different eras. Some of the greatest ODI batsmen are part of this elite list of players who have crossed a chasing high BI ratio of (1.75 and 1.40) across multiple eras.
In the above table, the player’s name, and his nth appearance (in parentheses) across different eras has been documented. For instance, Vengsarkar made his 2nd appearance at a chasing BI ratio > 1.40 in the second era. It must be noted that a player’s multiple appearance in the 1.75 column is not reported in the 1.40 column, although it is axiomatic. For example, Gordon Greenidge had a BI ratios of ~1.63 and ~2.21 in the first two eras, but since he didn’t cross 1.75 in both the eras, his presence is noted in the 1.40 column.
In the 1.40 list, only Lara and Jayasuriya have made their nth appearance across non-consecutive eras. And, only three players feature across 3 eras: Lara, Dhoni and Gayle. If the bar is set higher at 1.75, this rarified air is occupied by the Richards, Tendulkar, Gilchrist, AB de Villiers and Kohli; all of them bonafide legends of the ODI game. Amongst these champions, only Tendulkar and Gilchrist have carried this scarcely believable chasing BI ratio over 3 eras. However, it must also be remembered that the first era was 14 years long, and Kohli and AB de Villiers might still chase at their present levels in the coming years.
What can be said about teams who have a procession of batsmen with guts of titanium?
It is reasonable to assume that a team with multiple such players during an era will, on an average, be better at chasing when compared to a team with poor chasing resources. It also follows that a batting lineup with 3 such batsmen is effectively worth at least an extra batsman in the chase, on an average. Hence, the last thing to do would be to see how many batsmen had excellent chasing BI ratios in different eras, and how their teams fared due to their talents.

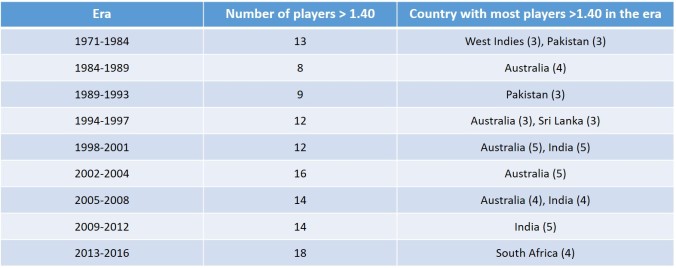
True grit: The countries with the most number of good chasers in each era have won international tournaments.
In every era, only 9 to 17 batsmen have breached the 1.40 chasing BI level, showing how selective this benchmark is. In 6 eras, one team has had the clear lead in the number of such batsmen at their disposal. And, in the 3 eras where multiple teams have held this honour, either no one team has dominated over the rest, or the said teams were part of a generational shift.
Unsurprisingly, there is a clear correlation between international success during a particular era and the number of high quality chasing personnel in the team. Every time a single team has led the stockpile, it has experienced on-field success; every one of these well-stocked teams have won at least one multi-nation trophy during the era.
Coming to think of it, this correlation is intuitive: cricket championships are invariably decided by knockout matches after a group phase. By default, the winner would not have lost in a knock-out match (duh!). There have been 78 knock-out matches in multi-nation international tournaments (World Cup, Champions Trophy, World Championship of Cricket); teams winning the toss have shown a clear preference to bat first (50 times), and use the scoreboard pressure to their advantage. It also follows that every team that reached the final would have invariably chased in a knockout match more often than not, and chase well.
Indian fans scalded by the losses in the 1996 semifinals and the 2003 final may not have known this at the time, but when India were faced with a stiff chase of 275 in the 2011 World Cup final, they were well equipped to stage the heist. They were not the same team from the previous generations which had only Tendulkar (supported by Ganguly and Sehwag in two eras, respectively) to count on. Despite getting knocked out by Sri Lanka in the 2007 World Cup group stage – in a chase – they had finally turned a corner as a chasing team during the era, boasting of Dhoni, Yuvraj and Sehwag in their ranks.
One era later, they had gone one better in terms of the number of strings to their chasing bow, as the stats suggest: Kohli, Gambhir, Dhoni, and Raina – all having chasing BI ratios in excess of 1.40. As a demonstration, just a few days prior, the team had even overcome Australia (that too in a chase), en route to the final. Unsurprisingly, Gambhir and Raina had key roles to play in that humdinger of a quarterfinal at Ahmedabad. The risk of chasing had now been hedged over multiple batsmen, rather than just Tendulkar at the top of the order.
What transpired in the match is now part of Indian cricketing folklore: In reply to Sri Lanka’s 274 headlined by Jayawardene’s sublime century, a generation of cricket fans shuddered when India were reduced to 31/2. Visions of 1996 and 2003 may have haunted fans, but not this team bursting at its seams with high-class chasing pedigree.
Kohli and Gambhir played in their part in a mini-recovery; Kohli’s dismissal brought in Dhoni, who would deliver the game’s denouement with his defining contribution. Later on, Sangakkara would later on ruefully note that the total was insufficient, considering India’s batting depth in the chase. You bet he was right.
Looking back, Dhoni’s quip (and innings) was a sentence alright; and a fine death sentence to Sri Lankan ambitions, and Muralitharan’s ODI career, at that. The fans who had seen countless Indian chasing nightmares unfolding in front of them in the ‘90s would sleep a good night’s sleep (or not, if they were celebrating).
The fans watched on breathlessly with anticipation, with Ravi Shastri’s commentary blaring out of the idiot box, not grudging him for his tracer bullets, as the match headed to an inevitable climax. That freeze-frame shot for six would forever be etched in the collective memories of Indian fans, as much as the image of Kapil Dev – bearing a toothy grin – hoisting the Prudential Cup on the Lord’s balcony.

Sealed with a six: Dhoni’s strike is now part of Indian cricketing history. Image source: 2.
“….and Dhoniiiiiiiiii finishes off in style, a magnificent strike into the crowd…”
Except, this time the sentence didn’t just end in a full stop, but with an exclamation point.
Disclaimer: Some images used in the article are not property of this blog. The copyright, if any, rests with the respective owners.


