A World cup squad for the ages

The quadrennial cricketing extravaganza that is the Cricket World Cup begins in less than 48 hours when England take on South Africa. The sports pages of every news publication, online and offline are filled to the brim with stories about the players, squads and unforgettable moments of yesteryear. With excitement building up towards this grand, we decided to throw our hat into the ring with a fun exercise of our own—building a hypothetical all-time XI.

What would serve as a fair selection criteria that can be applied across the board to facilitate such an exercise in fandom? Firstly, only performances from the ODI World Cups will be considered. Secondly, the player should have played in at least 10 World Cup matches and 2 editions; this criteria is to ensure that players with a stellar showing in one tournament (for example, Shikhar Dhawan) don’t necessarily upstage players with longer, more consistent World Cup records. As a consequence of these two criteria, many players with stellar ODI records (thinking of you, Virat Kohli and Joel Garner) unfortunately miss out, but present-day players certainly have a chance to correct this in the future. The squad would nominally have 6 batsmen (2 of whom can serve as the 6th bowler), 1 wicketkeeper-batsman, 4 bowlers and 1 all-rounder but there is scope for some flexibility. With this in place, let us move on to the players themselves.

Wicketkeeper-batsman

Four wicketkeepers have stellar World Cup records: Adam Gilchrist, Kumar Sangakkara, Brendan Taylor, and Brad Haddin. Both Gilchrist and Kumar Sangakkara have had longer and more productive careers compared to the other two—hence it is down to these two. Both are excellent glovemen and hence the debate between the two will come down to batting (see below).

Top order (1-3)

One name automatically makes the list: Sachin Tendulkar. Who can argue with the batting pitamaha’s overall record and a stellar showing in three world cups? The identity of the other two players will no doubt cause much deliberation. Will it be his illustrious batting partner, Sourav Ganguly? Or explosive southpaws such as Adam Gilchrist or Sanath Jayasuriya? We then looked at players who married consistency with strike rate at the top, leading to 4 other contenders—Mark Waugh, Herschelle Gibbs, Matthew Hayden, and Tillakaratne Dilshan. Despite Dilshan’s edge as a part-time bowler, the fact that his best performances came against the “lesser” teams put him out of contention. With little to choose between the other three, we chose Matthew Hayden for his left-handedness and higher strike rate.  For the number 3 slot, Kumar Sangakkara’s consistency was hard to overlook and he easily towers over Ponting, Kallis, and Lara. A case could be made for playing both Gilchrist and Sangakkara but Hayden’s advantage (~+15 average) won the trade-off against Gilchrist’s stats (~+5 strike rate). Besides, we have packed the side with plenty of firepower in the middle order.

Hayden: 22 matches, 987 runs @51.94 avg. and 92.93 SR

Tendulkar: 45 matches, 2278 runs @ 56.95 avg. and 88.98 SR

Sangakkara: 37 matches, 1532 runs @ 56.74 avg. and 86.55 SR, 41 catches and 13 stumpings

Middle order (4-6)

As was the case in the top order, one more name automatically makes the list at number 4: Viv Richards; his handy bowling and fielding complemented his destructive batting well. The following act is a recent-day player who probably was the closest to Richards in his pomp—A B de Villiers. The number 6 and 7 candidates are some of the hardest to fill—is it better to pick someone like Javed Miandad, or Steve Waugh, who can marshal the lower order and bring in the big hits when necessary? Ultimately, we went with flexibility and power as the top 5 have enough batting ability and consistency to stave off even the most hostile bowling attack.

Viv Richards: 23 matches, 1013 runs @ 63.31 avg. and 85.05 SR

A B de Villiers: 23 matches, 1207 runs @ 63.52 avg. and 117.29 SR

All-rounders (6-7)

There are only 4 players under consideration—Imran Khan, Kapil Dev, Yuvraj Singh, and Lance Klusener. Imran Khan has an outstanding bowling record but his batting is less than stellar. Following Viv Richards and A B de Villiers is already a difficult task and his ~66 SR would be out of place, even if it were to be “inflation-adjusted”; Lance Klusener has an amazing batting and bowling record in the World Cups and he would totally fit in in today’s T20-fuelled era; Yuvraj Singh is more a part-time bowler who had one good World Cup bowling-wise. Kapil Dev’s World Cup bowling record is merely “average” by his own lofty standards but his batting takes the cake—who can forget his immortal 175* against Zimbabwe? In the end, it is a very tough call between Kapil Dev and Imran Khan but considering that the top 5 are very consistent, we went with batting power over bowling chops. Kapil, Klusener, Richards, and Tendulkar can more than capably bowl the 5th bowler quota.

Lance Klusener: 14 matches, 372 runs @ 124 avg. and 121. 17 SR; 22 wickets @ 22.13 avg.

Kapil Dev: 26 matches, 669 runs @ 37.16 avg. and 115.14 SR; 28 wickets @ 31.85 avg.

Fast bowlers

For the fast men who will take the new ball, it is hard to look beyond two legends of the game—one known for unerring and nagging consistency, and the other, the sultan of swing. Yes, we are referring to Glenn McGrath and Wasim Akram. Unsurprisingly, they have the highest number of wickets in the World Cups (fast bowlers only). Other capable candidates such as Chaminda Vaas, Zaheer Khan, Lasith Malinga, Brett Lee, and Shane Bond miss out due to the illustrious careers of these two new ball schemers.

Wasim Akram: 38 matches, 55 wickets @ 23.83 avg.

Glenn McGrath: 39 matches, 71 wickets @18.19 avg.

Spinners

Here too, it is difficult to look beyond the two champion spinners of the game—Muttiah Muralitharan and Shane Warne. Though Warne has played only in two World Cups, his overall record pips him to the final bowling slot ahead of Vettori, Hogg, and Kumble.

Muttiah Muralitharan: 40 matches, 68 wickets @ 19.63 avg.

Shane Warne: 17 matches, 32 wickets @ 19.50 avg.


Squad balance and captaincy

Overall, the squad has it all—consistency at the top and middle, explosive power in the middle order, left-right combinations galore, a bowling quiver full of all types of arrows, lower-order batting in Akram and Warne, and even comic value in two genuine number 11s. Who will be the captain? Imran Khan would have been an obvious choice had he made it, but since we’re picking the captain after making the 11, we would pick Kapil Dev. Kapil Dev was even more crucial to India in 1983 than what Imran was to Pakistan in 1992, and he transformed a bunch of no-hopers to world champions against all odds through a mix of self-belief, inspiration, and leading from the front. Imran, on the other hand had an excellent bowling unit and decent batsmen coming up the ranks. For this reason, Kapil paaji da jawaab nahin. The cerebral Sangakkara will serve as his able deputy.

All time World-cup 11: Matthew Hayden, Sachin Tendulkar, Kumar Sangakkara (wk & vc), Viv Richards, AB de Villiers, Lance Klusener, Kapil Dev (c), Wasim Akram, Shane Warne, Muttiah Muralitharn, Glenn McGrath

Memories from Down Under

Size of the challenge: Virat Kohli leads his Indian team on what could be one of the best chances to win a test series in Australia. Image source: 1.

Indian tours to Australia have mostly been one-way traffic—the late Jaywant Lele’s (no, not McGrath’s) famous prediction of a 3-0 drubbing just before the 1999-00 tour comes to mind. In addition to India traditionally being poor travellers, Australian teams have been the toughest opposition for most teams. However, as teams around the world got crushed by the Aussie might, India were the one team that competed—often, in the most trying circumstances—against the Aussies during their period of dominance.

With Smith and Warner serving their post-Sandpapergate bans, the chatter among pundits and fans alike is that the imminent series represents a great chance for the Indian team to win their first ever test series in Australia. It is also worth remembering that India went with high hopes in the last two away tours but eventually fell short; before each tour, Ravi Shastri boldly proclaimed that their performances would define the legacy of this Indian team, but the post-series press conferences witnessed a tetchy Virat Kohli showing his combative side to the media. While the fans have been buoyed by the sight of Indian fast bowlers dismantling the opposition, questions about the batting and team selections still linger.

With this backdrop, this is a great time to recall some memorable Indian tours to Down Under. Additionally, can an analytical approach be used to draw some insights based on what was expected and how the series panned out?

In this article, three tours have been chosen: 2003-04, 1991-92 and 1980-81. The 2007-08 series was memorable as well, but going further back in time presents a chance to relive one of India’s greatest wins.

Now to the methodology. The strength of the two teams in the lead up to each tour is measured by 4 parameters—Batting experience (matches), batting strength, bowling experience (matches played by bowling unit) and bowling quality. Readers should note that the matches played by the bowling unit features both in the batting and bowling experience; this is because bowlers are called upon to bat much more frequently compared to batsmen rolling their arms over. Since home teams call up fewer players than away teams, the number of players has been indicated in brackets to provide additional perspective.

Table 1: A dissection of pre-series positions a post-series results on previous Indian tours to Australia

Consequently, batting strength is calculated by summing up the batting averages of all players (weighted by matches played in the series) and adjusting it to 10 dismissals. The batting strength (the higher the better) can be thought of as the average score that the batting lineup would have made during the series. Similarly, the bowling quality is calculated by adding bowling averages weighted by with the overs bowled. This can be thought of as the quality of composite bowling lineup (the lower the better) faced by the opponent; multiplying the bowling quality by 10 can give a sense of the runs conceded per innings.

For both these measures, career-to-date averages (till the start of the series) have been used, except in the cases of players who have played 10 test matches or less. Typically, new players take time to establish themselves in the side and hence their values have been fixed looking at historical trends (batsman-30, wicketkeeper/allrounder-20, tailender-10 for batting strength; bowler-35 for bowling quality). An argument could be made to account for home-away disparity (adjusting by ±5%), but in the interest of simplicity, the values have been used without further adjustment as they can be easily gauged.

2003-04

India faced off against a very strong Australian team, which scored ~20% more runs per innings compared to the average. Boasting of champion batsmen, Australia had the license to go all out and pummel the opposition into submission. The Indian batting was just about finding its feet in overseas conditions and they delivered most memorably in Adelaide. However, this magnificent victory has to be tempered based on the bowling lineup India faced; Australia, missing McGrath and Warne, presented a rookie bowling attack (79 tests old) which was far worse than the ~30 bowling quality. Additionally, their one world-class bowler, Gillespie, bowled only 10.2 out of 72.4 overs when India chased 233 for victory at Adelaide.

The two absent champion bowlers were veterans of 202 tests and had captured wickets at 21.71 and 25.71 respectively, and their replacements weren’t simply good enough. Just one stat is enough to distill their importance to the Australian team: with either of these two bowlers in the side, Australia lost only a single match at home in over a decade (that too, by 12 runs). This is not to belittle Dravid’s finest hour as one can only score against the bowlers bowling against you, but one has to be mindful of the circumstances in which this fantastic result was achieved. Keeping this in mind, the standout performance on the tour was undoubtedly Agarkar’s—taking 6/41 at Adelaide against this Australian lineup. The Indians also didn’t have the bowling to win the series in Sydney, allowing Steve Waugh to hold fort for a drawn series in his farewell test, but performed admirably throughout the series given their bowling quality.

1991-92

On paper, this tour looks like a drubbing at the hands of a less-experienced, lesser skilled Australian team; the first two tests were certainly so, but the next two were mightily close. Trailing by 170 runs, the Aussies slipped to 114/6 before a lower-order rescue act by a dogged Allan Border took them to a draw against below-average Indian bowling. Similarly, chasing an improbable 372 to win in the 4th innings, Azhar and Prabhakar kept India in the hunt but India would lose narrowly by 38 runs (~2 lower order partnerships). Though India lost 4-0, the result could have been easily different if a few events had fallen in India’s favour. Sachin Tendulkar’s emergence as the next champion batsman was India’s biggest plus on the tour.

1980-81

In our opinion, this tour contains India’s finest ever away win. The two teams were evenly matched before the series, but truth be told, India’s bowling was poorer than the suggested bowling quality of ~29, for, Dilip Doshi and Shivlal Yadav were far worse in Australian conditions compared to their bowling averages of 30.37 and 26.15, which were largely bolstered by home performances.  India were duly walloped in the first test by an innings, and barely held on for a draw in the second, but it was the third test which was the stuff of legend. The test, now more remembered for the Gavaskar-Lillie spat, featured a lion-hearted performance by an injured Kapil Dev. Trailing by 182 runs, India managed to bat better in the 2nd innings and muster 324 runs to set the Aussies a target of 143.

The fuse was lit by Karsan Ghavri on the fourth evening, but it was Kapil Dev who finished the Aussie demolition job by coming in to bowl in the 4th position and taking 5 wickets, skittling them out for 83. Without a doubt, this rivals the immortal 2001 Kolkata test in terms of the difficulty of the task. Of course, a juggernaut of an Australian team—on a 16 match winning streak—halted in its tracks by an Indian team facing imminent defeat after being asked to follow on, is the stuff of a Bollywood potboiler and hence the better story.

The upcoming test series resembles the 2003-04 in some respects; here too, Australia are missing two crucial players in Warner and Smith. The two teams should be well-matched in the bowling department, but the key to the series will be based on which team can negotiate the other’s bowling and put the runs on the board to avoid defeat.

Disclaimer: Some of the images used in this article are not property of this blog. They have been used for representational purposes only. The copyright, if any, rests with the respective owners.


Setting expectations for Ashwin and Jadeja in South Africa

A new turn awaits the spin twins. Image source: 1.

The cricketing world and its citizens will be watching with great anticipation when the Indian team takes on the mighty Proteas in the upcoming series in the Southern Hemisphere. An Indian team—with personnel who have experience of playing in South Africa—which has won its last nine series, will be facing off against a South African team which polished off Zimbabwe in two days. This contest that will be played over three test matches has all the makings of a marquee series if one were to look at the ICC rankings. The top two test teams taking on each other. Seven of the world’s best 14 batsmen.  Six of the world’s best 14 bowlers. Two returning stalwarts in A B de Villiers and Dale Steyn, who will no doubt remember the drubbing they received in India, and will be motivated to return the favour.

When the Indian team takes the field in the first test in Cape Town, the spin bowling department will be under intense scrutiny with multiple sub-plots. Is there space for both Ravindra Jadeja and Ravichandran Ashwin, ranked 3 and 4 on the ICC rankings (the top ranked spinners)? Unlikely, considering the traditional conditions in South Africa, and given that Rahane’s recent form has been patchy, the team management may not play the fifth bowler. Then which one will get to play in this cricketing version of Sophie’s choice? Would it be the higher ranked Jadeja who had a six-for in the previous series, or would it be Ashwin, who went wicketless in his 42 overs of the solitary test he played the last time around? How will they hold up against Keshav Maharaj, the opposition spinner?

Regardless of the difficult decisions that the team management undoubtedly have to make, one reckons if this is an acid test for both these men with regard to their test cricketing stature. Both these tweakers started off as limited overs specialists; however, their limited overs stock has plummeted in recent times just as they have made their names in the test arena. Both spinners have bowled extremely well and at home, and also at West Indies and Sri Lanka recently. But unless they muster eye-catching performances overseas, starting from this South Africa tour, it looks like they will unfairly labelled as home-track bullies.

So what do these bowlers have to do to excel in South Africa? Are there any clues that can be obtained from spin performances of the past? Can we expect them to rip out the South African lineup or do we have to temper our expectations?

Since their readmission to the cricketing fold, South Africa have been a formidable team, even more so at home. They have a Win-Loss ratio of 2.8, and have triumphed in nearly 60% of their home matches. Barring the champion Australia team, only England have found success in South Africa. Spinners have struggled, taking 448 wickets at a bowling average of 39. In 125 matches, a haul of five wickets or more has been snared by spinners only 17 times. Keeping all this in mind, it is fair to say that only a handful of spin bowlers have flowered and bloomed in this desert.

Bowlers like Shakib Al Hasan, Mushtaq Ahmed, Danish Kaneria, Rangana Herath, Harbhajan Singh and Graeme Swann have had the one good tour in South Africa. But since this is the second tour for Ashwin and Jadeja, they need to aim higher.

Bowler Matches Bowling average (away, SA) Wickets
Shane Warne 12 24.31 61
Muttiah Muralitharan 6 26.02 35
Anil Kumble 12 32.02 45


Of the spin bowlers who’ve visited South Africa at least twice since readmission, three names have performed on more than one tour: Shane Warne, Muralitharan and Anil Kumble—all legends in their own right. Overall, only Warne and Murali have had great returns in South Africa over their entire career. However, even they nabbed a five wicket haul at a much lesser rate compared to their 1 in 5 combined career tallies. Hence, a lesser tally can be expected in Ashwin’s and/or Jadeja’s cases as well. What about the other variables? Upon careful examination of their records, several trends become clear.

Bowler Bowling average

(1st innings)

Wickets

(1st innings)

Bowling average

(2nd innings)

Wickets

(2nd innings)

Shane Warne 30.41 24 20.35 37
Muttiah Muralitharan 31.75 20 18.40 15
Anil Kumble 38.87 24 24.19 21


Barring a few outlier performances, South African pitches have been unfriendly (even for these spin-masters) in the first innings; their strike rates (balls per wicket) hover at values greater than 12 overs, a clear marker of the uphill task awaiting the Indian spinners. On unhelpful pitches, they must be ready to embrace a support role. In complete contrast, bowling in the second innings has been far more rewarding. Of course, one mustn’t forget that the second innings only comes into play once parity has been achieved in the first—a traditional Achilles heel for the Asian batsmen.

Bowler SA batting average

(1st innings)

Away team batting average Bowling average

(2nd innings)

Away team batting average
Shane Warne 27.24 36.93 27.52 36.20
Muttiah Muralitharan 41.68 23.91 26.92 20.21
Anil Kumble 34.57 28.10 34.68 22.21


Of the three spinners, only Shane Warne bowled with the relative comfort of a first innings lead. The all-weather, all-conquering Australian team were able to compete on both the batting and bowling fronts against South Africa. On the other hand, the Asian champions suffered from a lack of batting support. For perspective, consider the first innings batting average differential. Shane Warne bowled in the second innings with nearly a 100 run lead. Whereas, Kumble and Murali bowled magnificently in spite of a ~60-120 average run deficit; meaning, they were always chasing the game.

Bowler Fast bowling support (10 wickets, bowling average<30) Spread of bowler wickets across the batting order
Top order

(1-3)

Middle order

(4-7)

Tail

(8-11)

Shane Warne 5* 23.0% 42.6% 34.4%
Muttiah Muralitharan 0 22.9% 48.6% 28.5%
Anil Kumble 3 31.1% 35.5% 33.3%


Share Warne was also blessed with other wicket-taking bowlers like McGrath, Gillespie, Brett Lee and Stuart Clark. Why, even Steve Waugh (denoted by *) took wickets at an impressive rate. Anil Kumble bowled alongside Srinath, Prasad and Sreesanth—three Indian bowlers who did well in the Rainbow Nation. Bowling support is also a recurrent theme in the tales of the spinners doing well in a solitary series– Mohammed Asif, Waqar Younis, Lahiru Kumara and others set the stage for their spinners to do well. But one must doff his/her hat to the Sri Lankan champion Muralitharan—who bowled with virtually no batting or bowling support. All things considered, it is easily the best bowling performance by a visiting spinner on these shores since their readmission. Also, Warne and Muralitharan had a similar distribution of wickets across the batting order; whereas, Anil Kumble made more inroads in the top order.

What about the upcoming test series then?

The first two tests are at Newlands and Centurion, where spin bowling has traditionally suffered. The third test is at Jo’burg, where spinners have had it easier; with no Kingsmead on the list, the one venue where spinners have feasted is missing. Looking at all this, the Indian spinners have to play a supporting role in the first innings, and only come into play in the second for most of the series. Batting and bowling support is very much a necessity to influence the outcome of the match. The traditional second innings advantage will surely come to naught if the batting collapses. All eyes will be on the batsmen and the fast bowlers to stand up to the challenge.

Disclaimer: The image used in this article is not the property of this blog. It has been used for representational purposes only. The copyright, if any, solely rests with the respective owners.


The bowling avengers: completing the squad

We’re back to the year 2030. As discussed earlier in this series, a mysterious group of aliens have landed on Earth and are interested in facing off against the Earth’s finest in a one day international (ODI) cricket series which will seal the planet’s fate. It has now been six months since the various wise heads of the BCCI put their brains together to come up with a hypothetical batting lineup combed from ODI history to face the alien might.

Meanwhile, the aliens have gotten comfortable on Earth, and are getting to grips with its various quirks as they are going about their daily cricket practice routines. There is a lot of confusion regarding the status of the aliens—whether they are illegal immigrants or refugees—and this is occupying columns of newsprint in the West. Back home in India, the epicenter of all the action, some events are predictable and comforting. The jury is still out on demonetization. Salman Khan is still making movies, and employing a driver in the age of driverless cars. Rahul Gandhi’s latest speech is touted to be his coming-of-age moment.

The aliens are now anxious; it has taken more than six months for the BCCI to come up with half a team. The last table thumping did not have the desired effect or response from the BCCI. On their part, the BCCI are complaining about impending Presidential elections and the saga of various state associations not falling in line. Plus there is the small matter implementing the Supreme Court recommendations.

Furious at the inaction, the aliens issue yet another ultimatum, and decide to go nuclear. No, not by any means of violence; they simply choose to rewrite the various broadcasting, internet, TV and VR rights for the various India home series and the IPL. Suddenly, the BCCI wake up from their slumber and swing into action. They now huddle together in order to complete the lineup with a 15 member squad, of which only the batting lineup have been chosen so far—Tendulkar, Amla, Kohli, Richards, de Villiers, Dhoni and Klusener. This fictitious exercise is a culmination of scouring the history of ODI cricket to identify the players who outperformed their peers.

How do we go about selecting the rest of the team?

The ODI format of cricket has changed its spots over time. In the initial days of the format, teams often treated it as a truncated version of the test match. Besides, teams also had 60 overs to negotiate. With the advent of power-hitting at the start of the ODI in the early ‘90s, the game pivoted to a much more frenzied approach against the new ball. Since then, the economy rates of bowlers have been continuously on the upswing. Plus, we now have a newer format (which rewards power hitting a lot more) to contend with—the T20.

In spite of bowlers receiving a hiding over the last few years of the ODI, the basic resource dynamics of the game hasn’t changed. In the game of cricket, three basic quantities are measured—runs, balls and wickets. Depending on the format of the game, the importance of each quantity (and their interplay) varies. Considering that an ODI can be won by either bowling out the opposition or by run containment, a good bowler needs to be on top of two metrics: one, the bowling average (runs conceded per wicket), and two, the economy rate (runs conceded per over). They are the bowler’s equivalent of batting average and strike rate respectively.

The product of the two (divided by 6)—often called as the Bowling Index (BoI)—has been used by ESPNCricinfo and many others as a tool to benchmark bowlers against their peers. Usually, analysts have compared a bowler’s BoI with the corresponding BoI of the average bowler during the said player’s career—this is a method that has also been used by us in our earlier exercises. This is a solid, first-cut method no doubt, but it has some inherent disadvantages, which will be discussed and addressed shortly.

1.jpg

Table 1: Variation of Bowling Index (first) across the batting order in different time periods

2.jpg

Table 2: Variation of Bowling Index (second) across the batting order in different time periods

Upon detailed examination of the above BoI tables, some characteristics of bowling in ODIs become apparent. One, bowling in the first and second innings are totally different ball games with respect to the BoI; two, bowling at the top of the bowling order is far more advantageous with respect to bowling statistics (and hence encapsulated by the lower values of BoI).

In the previous two articles of our bowling series, the BoI concept was extended in order to examine which bowlers dominated their peers in terms of their performances. We had computed and compared BoI ratios (by dividing the baseline with the BoI of a particular bowler during an era) of various players during the first and second innings of the ODI over the course of the history of the ODI (nine ODI eras in total, each having an excess of 250 matches). A benchmark (BoI ratio of 1.40) was also applied across the board (after an appropriate cutoff, of course) in order to separate the elite performers during a particular era. A BoI ratio of 1.40 represents a 40% higher performance over the average bowler. It must be noted that a BoI ratio of 1.40 is extremely rare, and less than 20 players have achieved it during every era under consideration (all stats until Dec 31, 2016 have been included).

Many bowlers have been able to perform at a very high level in some eras (Ajanta Mendis, for example), but have struggled to replicate it across multiple time periods—except for the very few standout performers who have shone throughout their careers.

Considering that the ODI has undergone a sea of change from its first sighting in 1971, a hypothetical exercise like this raises many questions. How can players from one era be compared with the present day ones? What about players—like Brad Hogg—who have had stop-start careers? Can today’s bowlers, who bowl in such impoverished times, hold a candle to the legends of yesteryear? What about the changing rules of the powerplay, influence of T20 and smaller boundaries? So many issues to resolve.

Therefore, any analysis must take all these valid questions into consideration. Hence, we have to compare bowlers’ tallies with statistics relevant to their own careers. The grandfather of ODI batting, Sachin Tendulkar, played in a record 463 matches. In contrast, the bowler with the maximum appearances in ODIs is Wasim Akram with 356—a full 107 matches lesser than the overall record. On the whole, bowlers have a lesser shelf life, and this must reflect our cutoff as well. If the batsmen had a cutoff of 75 innings at 30 runs per dismissal, the bowlers have to clear the 50 innings, 50 wickets, 2000 balls bowled at 32 runs per dismissal. At the same time, this level is moderate enough not to exclude the modern outliers. This brings a total of 132 players under the lens.

The criteria for selection would be excellence over a sustained period of ODI cricket (interested readers can go through the era-specific values in the earlier articles), unless the gulf between the BoI ratios of a bowler with a short career and a long one is hard to overlook. Considering that many present day players may not have played in as many matches, the ones who could perhaps surpass the legends (in terms of BoI ratio values) in the future will be mentioned in the special mention category. Next comes the algorithm for selection.

3.jpg

Table 3: Variation of BoI (second) (%) using BoI (first) as a reference. Eg. BoI (second) is % higher for 1&2 compared to BI (first) between 71-84. (BoI (second)-BoI (first) /BoI (first))*100

Upon detailed examination of the above BoI tables obtained from the first two parts of the bowling exercise, it becomes clear that this method does not take three crucial factors that affect BoI values into consideration. One is the first to second innings disparity; second is the bowling order; third is the era centric values. To some extent, a uniform baseline takes care of the third factor, but the first two lie unaddressed. Considering that the spinners have struggled to match BoI values of fast bowlers, a tweak has to be applied to make sure there is decent representation across the board. This tweak has to be based on the bowling opportunities that was provided to the bowler during his career (until 31 Dec 2016).

Are there other concepts that we could use? The Average bowling position (ABoP) is a composite number representing the mean of all the bowling positions bowled in by a particular player. While the ABoP itself cannot reveal all information (as similar magnitudes of ABoP can be obtained by differing combinations of bowling position distributions), it can give us a snapshot of a bowler’s most usual bowling position in the bowling order.

Additionally, readers must also keep in mind that the bowling order is a lot more fluid compared to the batting order. For example, it can be said with a large degree of confidence that the openers are still at the crease at when the batting team have lost no wickets (barring rare cases of a batsman retiring hurt). However, a bowler can open the bowling, bowl the solitary over, and then complete his quota at the death; but the scorecard will still list his bowling position as 1. See the problem? Unfortunately, ball by ball data is not available for matches before 2001, and hence we will have to resort to the bowling order.

Using the same principle of the ABoP, the fraction of innings bowled in the first/second innings, in different bowling positions and in different time periods will be multiplied with the respective BoI values of all bowlers who bowled in similar circumstances (tables 1 and 2), which is then summed up to get the bowler’s BoI baseline (weighted) for that particular player. In some way, with this tweak, we will be comparing the said player’s BoI with a hypothetical, composite, average bowler—who has been afforded similar bowling opportunities (first/second innings, bowling position and era) during the player’s career.

Now that we have nailed down the algorithm for selection, we can move on to the selection of the players.

The bowling lineup should contain fantastic strike bowlers, with the inclusions for variety and part-time options as well. Considering that the batting lineup had Tendulkar and Richards, they can be expected to fill in the sixth bowler’s role in case one of the five receive a hiding from the aliens. The fifth bowler should ideally be an all-rounder who can bowl their full quota of overs (pace or spin) and is a competent batsman, in order to lend balance to the team. The batting exercise selected seven players (one batting all-rounder, one keeper and two sixth bowlers). In the remaining eight places, we can thus select three pacers, two all-rounders, two spinners and a spare player. Additionally, a left-arm pacer and a wrist spinner would be nice as well in the interest of variety.

4.jpg

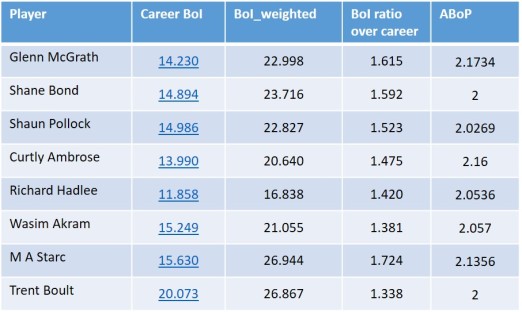
The metronome Glenn McGrath will be opening the bowling for the earthlings (note that players bowling at position 1 and 2 have been allocated a bowling position of 2). His BoI ratio stands apart compared to other opening bowlers such as Bond, Pollock, Ambrose and Hadlee. At the other end, Wasim Akram would be steaming in with his left arm swingers. Readers must note that in his young, 59 match career (until 2016), Mitchell Starc has racked up some ridiculous numbers. Considering that he has had a stellar 2017 as well, it might be wise to succumb to temptation and select him instead. Though, does Akram’s excellence at the death and the many headlining moments over 356 matches shade the younger man’s career so far? Really tough call.

5.jpg

In the first change position is the all-time BoI ratio leader—Joel Garner. The extent to which the man towered over the rest (both literally and figuratively) can be gauged by the fact that no one else got close within ~8% of his career BoI ratio. Other fast bowlers (with illustrious colleagues) like Holding, Donald and Morkel also have excellent values in spite of bowling at no. 3. Perhaps, in any other team, they might have opened the bowling.

6.jpg

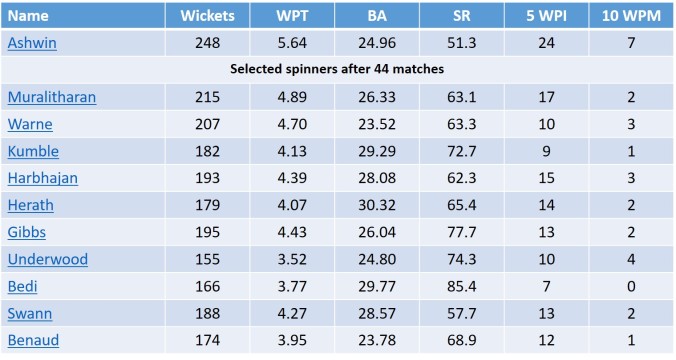
In the earlier method of comparing the player’s BoI with a flat baseline, spinners had poor representation. However, with this new method in place, their numbers are quite impressive in the overall scheme of things. Leading the tweakers’ pack is Saeed Ajmal, but given his history with his bowling action, Muralitharan will be chosen lead spinner. Saqlain Mushtaq is not far behind as well. In the case of wrist spinners, Imran Tahir (62 matches) has clearly outperformed his peers but would he walk into the side ahead of Shane Warne (194 matches)? Yet another case of Starc vs Akram.

7.jpg

What about the multi-taskers? Though part-timers like Allan Border and Darren Lehmann have great statistics (Lehmann doesn’t clear the 2000 ball cutoff), their ABoPs is close to six and hence they were only capable sixth bowlers—clearly not good enough to merit selection. In our team, all-rounders with more credible bowling abilities have been chosen.

8.jpg

Andrew Flintoff takes the pride of place amongst the bowling all-rounder pack—his batting numbers are pretty good as well. Klusener, Watson, Imran Khan, Kallis and Kapil Dev were better than their weighted baselines over their careers as well. Among the spin bowling all-rounders, Shakib Al Hasan is the undisputed leader with impressive bowling numbers; that he’s been able to post such statistics despite hailing from a weaker team is indeed commendable; him being a left-arm spinner adds to the variety as well. The presence of all-rounders adds a lot of depth to the team—the overall sum of the batting index (BI) ratio and bowling index (BoI) ratio gives an indication of their average contribution per match compared to the average batsman/bowler. Klusener is the overall leader due to his batting tilt; Flintoff and Shakib are very capable bowlers and they complete our set.

All that is left is the identity of the 15th player.

Is there enough cover for the pacers with only 3 frontline quicks? Should it be Holding, a pure pacer, or someone like Pollock who has a near-identical BoI ratio but can bat really well? Considering Flintoff is a super bowler in his own right, another pacer seems excessive. What about bolstering the middle order? Where is the left handed batsman? How can someone like Bevan or Hussey miss out with such high BI ratios? Not that it is any consolation, but Shakib Al Hasan is a decent batsman (though not in the same class); also—though he might not like it—Sachin Tendulkar could perhaps be persuaded to bat in the middle order if push came to shove. Shane Watson could also be considered as a batting pick due to his flexibility, but he wouldn’t displace any batsman on batting merit.

Considering all this, our BCCI’s last pick would be the left handed Adam Gilchrist—with a BI ratio better than Hayden (and close enough to the right handed Greenidge and Sehwag). What tipped the scales in his favour was his handedness, firepower (which could perhaps be deployed in the lower order as well) and his keeping ability. Yes I do hear that AB de Villiers has kept wicket in ~28% of his matches, but we wouldn’t want to burden the star batsman with additional responsibility given that the fate of the earth is at stake, would we?

This team has it all—thrilling openers, chase-meisters, finishers par extraordinaire, red-hot pacers, cunning spinners and multi-taskers supreme. Regardless of the nature of the pitch and the opposition, this squad should find the relevant answers; though, if the otherworldly beings turn out to be multi-limbed, irregular-formed, squiggly beings, I suspect the issue of handedness and leg before wicket will cause much consternation in the commentary box. The uber-cool, unflappable Dhoni would be captain of the side.

Bring on the aliens.

World XV: Tendulkar, Amla, Gilchrist, Kohli, Richards, de Villiers, Dhoni (c & wk), Shakib, Klusener, Flintoff, Warne, Murali, Akram, McGrath, Garner

Honourable mentions who could make it to the team in the future if they continue to perform at similar levels for a few more years: Buttler, Starc, Tahir


The spin doctor

In the lead up to India’s 500th test match in Kanpur, various print and online media outlets ran their own all-time India XI compilation articles: Espncricinfo to India Today, Wisden to The Hindu. Most of the squad members selected themselves, except for a couple of surprises. While there was general consensus that it was too early to consider Virat Kohli for an all-time XI (which is totally understandable), there were no murmurs that Ravichandran Ashwin made it to a few teams. Granted, India has always been a batting obsessed country but the spin cupboard was not barren either; India’s had a proud tradition from the days of Subhash Gupte, but that didn’t prevent Ashwin from being selected ahead of legends of days past. This is a testament to some of his achievements and current standing in world cricket.

0

Ahead of the pack: Ashwin has rapidly vaulted himself into all-time Indian XI slot contention with his recent showings. Image source: 1.

Ashwin has been the talk of the town ever since he remodelled his action; he has taken wickets by the bucket loads and his accomplishments over the last two years have been astonishing, by any yardstick (snide remarks by ex-India players aside). His appetite for wickets has been all too well documented. He is the first Indian bowler to breach the hallowed 900 level in the ICC rankings (similarly, only Gavaskar has crossed the mark amongst Indian batsmen). No other Indian bowler in history is in his vicinity with respect to the ICC ranking points. Hence, the aim of this article is to delve deeper into Ashwin’s standing amongst his peers and cast a critical eye on overseas records of spinners. Does Ashwin have a shot at all-time greatness à la Warne or Muralitharan?

First, we have to set the stage to understand the statistical perspective of a spinner’s canvas. For the purposes of this article, only test matches from 1 Jan 1946 to 20 Dec 2016 will be considered. Let us now proceed to see some popular measures used in cricket to quantify a bowler’s performance.

Strike rate (SR): Deliveries bowled/dismissal

Economy rate (ER): Runs conceded/six deliveries bowled

Bowling average (BA): Runs conceded/dismissal

Wickets per test (WPT): Wickets taken/number of tests played in.

Hence, it can be see that the Bowling average contains information about the Economy rate and Strike rate. Since it is a product of the two, a good (low) bowling average implies low values of the ER and SR. Therefore, we will primarily be using the BA as the first level filter; additional details will be obtained from SR and WPT wherever necessary. All the tables containing the statistics in this article can be downloaded from this link.

1

Fig. 1: Statistics of subcontinental spinners, ordered by total wickets for country. The leader in each column has been marked in bold.

We can now proceed to examine Ashwin’s record amongst his peers from the countries which boast of a spin-bowling tradition. He tops the table in SR, comes second in BA and bowls 45 balls/test lesser than Ajmal and Murali. That Muralitharan towers over the rest is quite evident from his statistics; he ranks first or second in every parameter. Amongst these spin legends, it is safe to say that his trajectory is moving towards Muralitharan.

2

Fig. 2: Comparision of Ashwin’s record against selected spinners’, after the 44 test mark

The extent of Ashwin’s records to date have to be assimilated by understanding the kind of start he has had. No other spinner since World War 2 has grabbed so many wickets in his first 44 matches. Ashwin is in a class of his own with respect to WPT, SR, 5 wickets per innings and 10 Wickets per match. From the above table, it is also easy to see how Murali tipped Harbhajan to break his records. Unfortunately for India, Harbhajan could not kick on from the start he got. At the 44 test stage, Warne and Muralitharan were in a class of their own. Hence, it is imperative to look at the Ashwin’s career trajectory with respect to these two legends.

3

Figs. 3: Variation of Career to date values of (a) Overs per test and (b) Wickets per test for the three bowlers.

The above plots of (a) Overs per test and (b) Wickets per test (WPT) are a progression of the cumulative real-time values. Meaning, the tallies at the end of every match are divided by the number of tests played to get an idea of how the player’s career performance statistics moved with time. To put it another way, these are career to date figures at the end of each test.

At the start, the perturbations to the values are quite large as the number of tests played is quite small. For these plots, the data for the first 10 tests have been taken into account but not shown to avoid the large spikes at the start of everyone’s career. Over time, the plots smoothen and all the values finish at the end of career values (for Murali and Warne). It also follows that creating a larger perturbation is relatively difficult at the end of the career due to the weight of the statistics to date.

From the graphs, it can be noticed that the two legends’ careers moved a bit differently. Both legends needed about 30 tests to get a grip of international cricket. Murali bowled significantly more overs after the 30 test mark, and got more wickets as well. Warne, on the other hand, bowled fewer overs (presumably, as he had to share them with a better set of teammates) but this did not impact his ability to take wickets majorly; his resurgence after the 100 test mark is an achievement in itself. Ashwin’s fortunes have taken an upswing after 25 tests and has bowled lesser overs per test. Perhaps it is more to do with his strike rate, as he has cleaned up sides faster than any spinner since World War 2.

4

Fig. 4: Comparision of Ashwin’s current wicket taking streak with Muralitharan’s peak

Can Ashwin overhaul Muralitharan’s tally? It will go down to how long Ashwin can keep his current wicket-taking streak going. In 20 test matches since 1st Feb 2015, Ashwin has captured 129 wickets at 19.69 runs/wicket, which is an unbelievable streak. Not considering Muralitharan, that is. The Sri Lankan had a streak four times as long, stretching a scarcely believable 79 test matches: 7.15 WPT, 565 wickets at less than 19 runs/wicket.

5

Fig. 5: Hypothetical progression of Ashwin’s career wicket tally with respect to Warne and Murali’s careers, at different wicket taking rates.

If Ashwin continues at 6 WPT, he can reach Murali’s mark of 800 around the 136th test mark (provided he plays for so long). India has typically played 8-10 test matches per year and he would be needing a decade of performing at this level in order to overcome that barrier. He will still reach respectable tallies if he can only muster 4-5 WPT instead.

6

Figs. 6: Variation of Career to date values of (a) Bowling average and (b) Strike rate for the three bowlers.

The career to date (a) Bowling Average and (b) Strike Rate graphs also throw up similar trends to WPT. Muralitharan continuously improved his stats from the 30th test matches till almost the end of his career. Warne had a relatively steady career in terms of his statistics after the initial 30 matches. Ashwin’s strike rate was hovering around 60 balls/ dismissal but his showing in the last 20 test matches has got it to all-time great fast bowler territory. These plots only confirm Ashwin’s progress in the last 2 years or so, but much of his legacy will be dependent on how he is able to perform at this level, and how he bowls overseas (Aus, NZ, SA and Eng).

Ashwin has been rightly criticized for his showing outside the subcontinent before 2015. But what about his recent performances in Sri Lanka and West Indies? Are overseas performances in temperate conditions the Holy Grail for spinners? Is it easier to bowl as an away spinner in the subcontinent? To answer some of these questions, the next step would be to understand the nuances of bowling statistics across host countries. This can be done by examining the differences in bowling averages of home and away spinners. A high BA for an away spinner would indicate that either the home batsmen are competent against spin, or that the conditions are not favourable for spinners (or both). The corresponding BA values of home spinners can also be used to make a judgement; negative values of BA differences (Home spinners BA-Away spinners BA) imply that the home spinners have out-bowled the away ones. In the case of Pakistan, UAE has been designated as a home venue.

7

Fig. 7: Overall bowling average of home and away spin bowlers across different countries. UAE has been treated as a home venue for Pakistan.

It can be observed from the table that India, Pakistan and Sri Lanka have been great home venues for spinners – a no brainer; on the other hand, away spinners have traditionally prospered in countries where batting has been weak. There also seems to be some truth to sub-continental batsmen being comfortable against away spinners; though, we don’t have the true picture of this “dominance” as they don’t get to face home spinners. One more thing to be noted here is that these values of BA are not fixed, but move with time based on a team’s strength. As we’ll take note shortly, the home BA values are great even in a non-subcontinental country when a good spinner plays for the home team.

8

Fig. 8: Variation in home spinner bowling averages at host country over each decade. UAE has been treated as a home venue for Pakistan.

A good way to check this out would be to examine the evolution of BA in different host countries across each decade. A decade is a good unit of time as it would include data from a lot of matches. Of course, there could be an odd case of data missing from a team in transition around the turn of the decade, but a 10 year span is a convenient time span to measure the progress of a team.

Since the overall bowling average of a spin bowler during the time of consideration is ~35, we can use this as a benchmark. From the table, it can be observed that Australia, England or West Indies were not always a barren place for spinners. Low overall values of home spinner BAs can be observed in those locations during the time of Richie Benaud, Jim Laker, Lance Gibbs, Shane Warne, Derek Underwood, Graeme Swann etc. India and Sri Lanka took some time to figure out that spin was their strength. On the other hand, New Zealand and South Africa are yet to see a champion spinner. Of particular interest are class-leading home spinner BA of ~24 for Sri Lanka during the 2000s and ~25.8 for India during 2010s.

How have away spinners fared on tours to different countries during these times?

9

Fig. 9: Variation in away spinner bowling averages at host country over each decade. UAE has been treated as a home venue for Pakistan.

The above table reveals many insights: Australia has been the toughest place to visit for an overseas spinner; Bangladesh have improved their record against spinners recently; pitches in England assisted spin in Laker’s time (batsmen were perhaps average in the 1990s); once India, Pakistan, and Sri Lanka found their batting giants, touring spinners never had it easy; New Zealand have not been pushovers against spin since the 1980s; South Africa took their time to adjust against spinners; and, the decline of Zimbabwe and West Indies are apparent. In the decade of the 1990s, all teams boasted good records against spinners.

So, which were the best places to tour as a spinner at different points of time?

10

Fig. 10: Variation in bowling averages differences (home spin BA- away spin BA) at host country over each decade. UAE has been treated as a home venue for Pakistan.

Using the same difference in bowling average measure, we can find periods in cricketing history when away spinners dominated over the home team. Here too, several patterns emerge: The 3 older subcontinental teams have rarely been outdone by their counterparts; England’s spinners underperformed for 3 decades; New Zealand has been a happy hunting ground until recently, the opposite holds true for the Windies; Australian spinners did not do well at home in the ‘70s; South Africa has never had a spin bowling champion; Bangladesh are fast closing the gap and Zimbabwe have slipped to oblivion. With all this information in hand, we can come to the following conclusions:

  • Fledgling teams take some time to get comfortable against spin, even in home conditions.
  • By the time batting strength is developed at home, away spinners are not as effective.
  • In general, home spinners do better than away spinners when teams are of similar strengths.

Using this, we can now prepare a list of selected host countries (discarding records where away spinner BA<30) to separate the wheat from the chaff. Why? We mustn’t forget that many aspersions have been cast on Warne’s and Murali’s records due to their tallies against England, Bangladesh and Zimbabwe at various points of time during their career. Hence, we need to address this issue of opposition quality adequately using exclusions.

11

Fig. 11: List of host countries in each decade where the home team has had a poor record against away spinners (BA<30). These host countries were excluded from the away spinner BA analysis for each decade.

We can now proceed to examine spinner performances away from home across different time periods, keeping in mind these exclusions; we wouldn’t want to set the bar low, would we?

12

Fig. 12: List of spin bowlers with (minimum number of away wicket cutoff applied) BA

For the eight decades in question, we need to come up with an objective selection criteria. The number of minimum wickets captured by a bowler is a function of the length of the decade and the number of matches played away against opposition with “good” credentials of playing spin. In the first decade under consideration, no spinner averaged less than 30 away (all countries except NZ). The top spinner was Jim Laker, who averaged a shade over 30 in this war-truncated decade (minimum 15 wickets). Moving on to the 1950s, the bar can be set at 25 away wickets, which would translate to tallies over at least 2 series. There are four spinners who have excellent away figures, led by the illustrious Richie Benaud. During the decade, his wicket taking feats were ably supported by Davidson, Lindwall and Miller. The pattern repeats for Tayfield, Valentine and Laker, the other spinners in this list; every one of these bowlers had the support of fast bowlers who similarly averaged less than 30 in these conditions.

The same motif repeats itself in all the other decades; spinners from teams having a good set of fast bowlers have much better returns against the “good” teams in away conditions. Tweakers like Hedley Howarth (NZ), Geoff Miller (England), Roger Harper (WI) and Paul Adams (SA) boast a better record when compared to noteworthy names such as Prasanna, Chandrashekhar, Bedi, Qadir, Kumble and Harbhajan. The only spinner to buck this trend of having fast-bowling support is peak level Muralitharan in the ‘00s – snaring his victims at nearly 29 runs/dismissal, a far cry from the sub-20 levels he hit during in his pomp. For the last 3 decades, the bar has been set at 40 wickets since the number of host countries has increased. In the 2010s, no bowler has been able to average at less than 30 runs/dismissal. The top bowler is Saeed Ajmal, who was slightly over the benchmark. Unsurprisingly, he had Mohammad Amir’s support during this current decade.

These trends shouldn’t come as a complete surprise to the cricket fans who’ve followed the game for a while. On an average, fast bowlers have better bowling returns compared to spinners; the most successful test teams of all-time boasted of some fearsome quicks in their pack; the bowling is opened by the pacers, who set the agenda for the spinners to follow; bowlers tend to bowl better with a better peer-group. Thereby, spinners profiting from the inroads made by fast-bowling colleagues follows as a natural consequence.

On this note, the odds are very much against Ashwin bowling really well abroad against the better teams, given the lack of Indian fast bowling pedigree. Then again, Ashwin has achieved more than any spinner during the start of his career (except perhaps Clarrie Grimmett). Like his predecessors, he needs to maximize his returns against the “weaker” away teams such as Bangladesh, West Indies, Sri Lanka and New Zealand and hope for an odd good series against the rest. India would certainly hope for Mohammed Shami and co. to develop as all-weather fast bowlers to aid him in his quest. All said and done, a fascinating sub-plot lies in front of us this time next year, when India tour South Africa.

Disclaimer: Some images used in this article are not property of this blog. The copyright, if any, rests with the respective owners.