The appeal of 4-day test matches

Recently, the ICC set the proverbial cat amongst the pigeons with by saying that it was going to consider the idea of 4-day test matches. If the cricketing world was looking forward to a quiet new year, this certainly yanked people off the usual boilerplate end-of-the-year self-congratulatory tweets. Suddenly, people were divided into two camps—the ones who thought it was a good idea (the likes of Michael Vaughan) and the ones who thought who thought it wasn’t (Sachin Tendulkar and many others). Let us examine what such a possibility may entail.

Cricket is a unique sport among those with a large following that its format has been tinkered with from time to time in order to fit it better with respect to the ongoing temporal demands. While the length of a football match has been 90 minutes (normal time), cricket has changed its spots often. First of all, cricket has three formats at the international level (with some new-fangled ones bound to enter the fray). The overs in an innings of the showpiece that is the ODI World Cup has varied from 50 to 60. Even in the “original format” of test cricket, the duration has varied between 3-day and “timeless” tests; heck, even the balls per over was not six always. Then what is the big fuss?

The argument behind such a move is financial—already very few teams can afford to play test cricket and the uncertainty regarding the fifth day’s expense burns a hole in many a broadcaster’s and home association’s pockets. And, considering the recent trends of an increasing number of tests finishing before the fifth day, this seems like a natural progression. Also, test matches can follow a Thursday to Sunday calendar, which is friendlier to the fans. So far, so good. But are there other reasons?

One of the peculiarities of test cricket is the draw (different from the tie); cricket fans worldwide have probably struggled to explain this concept to befuddled fans who don’t know much about the sport—how one can play a sport for days on end and still end up with no result? Only cricket fans know the value of a hard-fought draw. That idiosyncrasy aside, there is another pattern to be gleaned here—the Draw% indicates of how many matches finished with a result.

Decade Matches Draws Draw% Balls per test
1870s 3 0 0.00 1586.00
1880s 29 4 13.79 1666.97
1890s 32 6 18.75 1939.13
1900s 41 10 24.39 1803.41
1910s 29 4 13.79 1791.21
1920s 51 16 31.37 2247.33
1930s 89 36 40.45 2127.21
1940s 45 22 48.89 2378.04
1950s 164 51 31.10 2282.72
1960s 186 88 47.31 2409.01
1970s 198 84 42.42 2255.38
1980s 266 122 45.86 1986.76
1990s 347 124 35.73 2017.58
2000s 464 114 24.57 1974.86
2010s 433 84 19.40 1953.18


As the above table indicates, the 2010s has been a very productive decade for test cricket, with more than 80% of the matches ending up in a result (100%-draw% practically gives the result% as only 2 tests were tied throughout test cricket). This is a far cry from the days of, say, 1960s to 1980s, when this number was well south of 60%. The balls per test also shows an interesting trend with the draw%–both move in the same direction and seem to be correlated. Reducing the number of days is bound to eat into this high figure and push the percentage of results lower. The ICC plans to counter this by increasing the number of overs bowled in a day to 98, resulting in a “real loss” of 58 overs. Of course, one could also argue that pitches could be prepared accordingly and that the test match might “settle” into a new “rhythm”, but there are other inherent dangers.

One of them is weather related. In the sub-continent, cricket is a winter-time sport (unlike in England, SA, NZ, and Australia, where it is a summer-time sport) and teams routinely struggle to bowl 90 overs in a day, leave alone a greater number. And this problem is exacerbated at higher latitudes (as the duration of daylight reduces as the latitude increases). This was one of the factors why the Ranji Trophy increased the duration of the knockout matches—to increase the chances of an outright result. Additionally, the benevolence of the weather gods would play a bigger part—one washed out day has greater consequences. Both these factors would reduce the number of results.

The other is about the spinners. Though spinners have played important roles in test cricket, from a statistical perspective, they have slightly “inferior” records than fast bowlers (lower percentage of pure batsmen dismissed, lower bowling averages, higher strike rates and so on); this is natural since fast bowlers bowl before them and set the “tone” for the match—just the nature of the game, that is all.  But slice the numbers based on the innings number, you see a different pattern.

Innings Bowling Average (spinner) Bowling Average (pacer)
First 40.03 31.68
Second 35.09 31.56
Third 30.76 28.75
Fourth 28.30 27.68


As the test match progresses, the spinners show drastic improvement (~30% over the 4 innings), indicating the help they receive from the deterioration of the playing surface. For a fast bowler? Not as much—it does become easier to bowl, but the improvement isn’t as colossal (~13%). Yes, these figures aren’t grouped by Day 1 to 5 (ball-by-ball data wasn’t available until recently), but these trends are too big to ignore by themselves and are indicative of increasing assistance for spinners. Without the aid of an additional day (in which the pitch would be exposed to the elements and deteriorate further), spinners will surely suffer and be relegated to second-class citizens unless turning pitches are made world over.

The workload of the bowlers would increase as well, with each bowler having to bowl more number of overs per day. And, some of the most memorable matches have gone the distance—think Kolkata 2001 or the recent South Africa-England test. Decreasing the duration would only rob fans of some classic finishes.

Hence, the reasons to play test cricket over 4 days are purely financial; according to calculations for this test cycle (2015-2023), reducing the tests by a day would “free up” 335 days, which the boards can use as they please (probably to schedule more T20s to subsidize test cricket). Therefore, at best, the ICC should trial this in the matches involving the newer teams to reduce the costs and not tinker with the 5-day formula for the World Test Championship as it has a lot of balance for all players involved.


Why India’s home streak in tests has to be put into perspective

Unsurprisingly, India has won the test series against South Africa with a test match to spare. And though the test match at Ranchi is irrelevant to the outcome of the series, valuable test championship points are there for grabs. Though this series result was largely expected with the recent retirements of several South African stalwarts, the manner in which this was achieved was particularly impressive from India’s standpoint. Especially, the way the Indian pacers out-bowled their South African counterparts was heartening, to say the least.

During the Pune test, the South African batsman Temba Bavuma conceded that second test was played on a “more South African type of conditions” ground. The contrast from four years ago could not be starker; back then, the Saffers complained about “designer pitches”, which suited the bowling attack of the Indian team. But one statistic sort of slipped under the radar—this Indian team has won its 11th consecutive series at home, a streak longer than any other in cricketing history; not even the mighty Aussies or the West Indies in their pomp managed to win 11 consecutive test series at home (although, it must be added that Australia won 10 consecutive series twice).

Given this, why isn’t India’s streak at home celebrated as a hallmark of cricketing excellence? Why isn’t there much myth-making around India’s obviously incredible record at home? Yes, Steve Waugh did label it the “Final frontier”, but it has rarely featured since in the cricketing folklore.

Let us put India’s streak in perspective. In 2010s alone, India has lost only 4 test matches at home  out of 47 played, giving a scarcely believable W/L ratio of 8.5. And yet, I suspect many Indian fans will pooh-pooh this with the oft-repeated “Tigers at home, lambs abroad” punchline. While there was some truth to this two decades ago (I’m looking at you, the decade of the ‘90s), its home record is nothing to be scoffed at after the turn of the millennium.

Since 1970, 4 sides have had exceptional home records (Australia, Pakistan, South Africa, India), with little to choose between them over nearly a 50-year period; each one of these teams won between 2.75 to 3 tests to every test lost. While there might be allegations of biased umpires and designer pitches, it can’t be denied that this is an exceptionally consistent winning record at home over nearly five decades.

Slice this even finer, and three sides stand out. Lo and behold, the present Indian side is in great company (it must be noted that the overall Win% was much lower when the West Indies were trampling every side around the world).

Team (Era) Won Lost W/L Win%
West Indies (1978-1994) 31 5 6.2 58.5
Australia (1995-2007) 58 7 8.3 75.3
India (2007-2019*) 41 5 8.2 66.1

*all stats correct until the third test

Even if you were to examine teams under long-serving captains at home, 3 Indian captains—Azhar, Dhoni, and Kohli are close to the very top, once again showing that India have been formidable at home over multiple decades. Whichever way you look at it, these are insane numbers. However, there isn’t much acknowledgement about India’s home prowess, either from home or from abroad. Quite often, eyebrows are raised and aspersions are cast on India’s spinners abroad, especially outside the subcontinent. While there is some truth to this statement, it begs the question—if India is so friendly for spinners, why haven’t opposition spinners been able to take advantage (like Saqlain Mushtaq did)?

  2016-present averages 2012-2015 averages
Host country Home

spinner

Away spinner Away to Home Ratio Home

spinner

Away spinner Away to Home Ratio
India 25.32 51.18 2.02 21.67 32.22 1.49
Sri Lanka 28.38 31.42 1.11 27.51 33.09 1.20
Bangladesh 24.27 27.86 1.15 41.02 43.12 1.05
England 32.49 38.07 1.17 33.88 40.34 1.19
Australia 36.68 64.04 1.75 36.19 66.46 1.84
West Indies 41.51 29.88 0.72 30.79 35.77 1.16
South Africa 34.11 52.08 1.53 38.05 45.3 1.19
Zimbabwe 48.17 23.74 0.49 36.33 26.84 0.74
New Zealand 48 42.95 0.89 46.21 61.38 1.33
Pakistan/UAE 26.24 32.76 1.25 27.12 45.33 1.67

If one were to look at bowling averages of spinners in various countries (classified by home versus away), one can clearly see the locations where home spinners have enjoyed bowling—largely, the subcontinent. However, it can also be observed that in countries such as India, South Africa, and Australia, the home spinners dominate the away spinners by a large margin (as seen in ratio of bowling averages of away spinners to that of the home spinners). While the latter two can be labelled as pacer-friendly countries, opposition spinners should still be able to do perform in Indian conditions, isn’t it? Additionally, India is not as spin-friendly as it was between 2012 and 2015—meaning, results over the last four years should be viewed from this perspective.

In fact, while Indian pundits are trigger-happy in shooting down the performances of Indian spinners, they have performed really well abroad post-2015; coincidentally, it is also the time when the Indian pacers turned on the heat on the opposition batsmen in foreign conditions, pointing back to one of our earliest analyses on the necessity for pace-bowling support for spinners to perform to their fullest potential. In a similar vein, it is certainly worth wondering why certain pacers (looking at you, Jimmy Anderson and Vernon Philander) are not as effective as some of the legendary fast bowlers such as Malcolm Marshall, Richard Hadlee, Dale Steyn, Glenn McGrath, Alan Donald and others, who performed in Asia as well. Far too often, the Indian media is guilty of overvaluing Indian frailties abroad compared to that of the overseas media about their records in India/the subcontinent.

Therefore, there is no harm in recognizing and saluting India’s record at home—we should give credit where it is due. Over the last 20 years, it has taken superhuman efforts from South Africa, Australia (with the last day of the Chennai test rained out), and England to win a series in India. It is time that a test series victory in India is valourized and anointed as the toughest assignment in cricket.


The India Australia series provided a bowling-led blueprint for greater challenges abroad

Indian batsman K L Rahul drew the curtains to a closely contested series between India and Australia in the Border-Gavaskar trophy with a punch to midwicket. With that brace, Rahul had scored six fifties in the test series, becoming only the first Indian batsman to do so since 1983.  For a batsman who was pilloried as an “all or nothing” batsman having scored 4 hundreds and 7 sub-16 scores in his first 11 innings, key contributions to the Indian cause must have been sweet, no doubt. At the end of the hard fought series, Rahul’s show with the bat will count as yet another batting success for the Indian team.

That the Indian cricketing setup is obsessed with batting is an open secret. India’s biggest heroes in the test arena are its champion batsmen. Ranging from Vijay Merchant to Hazare to Gavaskar to Tendulkar to Dravid to Laxman to Sehwag, India have been blessed with a bevy of bewitching batsmen. The latest incarnation of the batting superstar is the captain of the Indian team in all 3 formats—Virat Kohli himself. India’s next batting champion was duly anointed at the end of the India-England series after Virat Kohli scored 655 runs over 8 innings. Another double hundred in the Bangladesh test, and he had outscored Bradman and Rahul Dravid with 4 double hundreds in 4 successive series. Normal service had indeed resumed.

Somehow, this series didn’t go according to plan in terms of the batsmen. Virat Kohli scored 46 runs in the series with an average of 9.2. The rest of the Indian batting too, found the going difficult with the bowler-friendly pitches on offer (barring Ranchi). Only Pujara and Rahul can be counted as batsmen who had a good run, each scoring over 390 runs in their 7 innings. Sure, Jadeja, Saha, and Rahane did make key contributions, but only the aforementioned two batsmen did well consistently throughout the series.

The series was won on the basis of fantastic bowling. Barring the 451 runs scored by Australia in Ranchi, the Australians couldn’t rack up more than 300 runs in a single innings. India’s incisive bowling was the main reason why they got into advantageous positions throughout the series. In the Dharamshala test, Australia were comfortable at 144/1 on the first afternoon before a Kuldeep Yadav inspired bowling attack bundled the Aussies for 300—what would be later on termed as a below-par effort for the surface. In the second innings too, taking out 3 batsmen before the first innings deficit was wiped out contributed to the comfortable Indian victory on the fourth morning.

The other test matches too had similar showings. Maxwell was dismissed at 331/5 at Ranchi, and India duly mopped up the rest of the wickets for 120 additional runs before propping up their Pujara-Saha inspired mammoth score. At 63/4 in the last innings, the Australians had to dig deep to stay alive in the series. Similarly, in the Bengaluru test, after India were bundled out for 189 in the first innings, it was their bowlers who limited the deficit to 87 runs; after the Pujara-Rahane show which got the bowlers a reasonable target to defend, the Indian bowlers were at it again, snuffing out any remote chance of a victory. It was an inspired show under duress, after Smith had told the press that they were a session or two away from regaining the Border-Gavaskar trophy. Even in the first Pune test, India had limited Australia to two sub-300 scores in spite of fielding lapses; it was their twin batting failures that had let them down.

In short, it was India’s bowling which shone throughout the series. Three bowlers snared more than 17 wickets each at less than 28 runs per dismissal. Of the players who have captained their sides for more than 20 test matches, Virat Kohli is at the top of the W/L charts. Granted, he is yet to go through the complete tour circuit around the world, but his learnings from his tenure so far would have given him enough lessons about building a successful test team.

Result Batting average Bowling average
Win 41.48 23.72
Loss 22.69 43.49
Draw 42.11 44.14


Over the last ten years, batsmen and bowlers have averaged ~33 and ~34 runs/dismissal. The disparity due to batting and bowling averages is due to extras and dismissals such as run-outs. While the exact same numbers may not repeat all through cricketing history, the truism of taking 20 wickets win a test match by bowling well ring loud and clear. In fact, the primacy of bowling in test match success is quite obvious from the above table. Good batting performances usually occur in wins and draws, but more often than not, a victory in test cricket is affected by an exceptional bowling unit.

In other words, good batting is mandatory not to lose a test match but is not alone sufficient to win it. With an ineffective bowling attack, it was no wonder that Indian teams led by Ganguly, Dravid, and Dhoni were unable to win more than a single test per overseas series. It is still early days in Kohli’s captaincy, but it is safe to say that the bedrock of his team’s victories were due to the champion bowlers at summit of the test rankings—Ashwin and Jadeja.

When India resumes touring duties against sides smarting from the test reverses, in the 2017-18 season, the think-tank needs to look no further from the blueprint of this 20 month long test run, and from earlier successful teams. In the earlier W/L list, only 6 captains among the top 25 had a bowling unit that averaged more than 30 runs/dismissal. Simply put, India needs to assemble a similarly effective bowling unit if it has to be successful in unfriendly overseas conditions as well.


Did Pujara bat too slowly in Ranchi?

The recently concluded debut test match at Ranchi produced a fascinating encounter between the two top teams of the test format. Each team had landed one big blow to the other in the previous two encounters, and the second victory was likely to be decisive; two wins for Australia, and they would retain the Border-Gavaskar trophy. A win for India, and it would be an affirmation of their prowess at home.

pujara-best-test-cricket.jpg

Another brick in the wall: Pujara’s recent exploits have propelled him to a career high ICC ranking. Image source: 1.

In the midst of all this, the Indian number 3—Cheteshwar Pujara—scored a crucial double ton. He hadn’t scored one in the test format for a while despite his reputation for racking up big scores. In this prolific first class season, he has amassed 7 hundreds and 9 fifties at 87.26 runs per dismissal. The ICC rankings have taken note, and he has climbed to a career high no. 2 ranking in the test batting charts.

In spite of scoring 202 runs, and having occupied the crease for more balls than any other recorded innings either by an Indian or any player in Indian conditions, it didn’t take a lot of time for his detractors to point to his “slow” innings. A strike rate of 38.5 was bound to rile a few T20 hipsters, especially when India couldn’t seem to dismiss the last 4 Aussie batsmen and win the match.

This is not the first time (and certainly not the last time) that aspersions have been cast on Pujara’s abilities. Why, about a year ago, Pujara was not a certainty in the test side with the team management favouring K L Rahul and Rohit Sharma in his place. The reason? Strike rate. Espncricinfo’s S Rajesh weighed in with his analysis and concluded that his strike rate pace in overseas conditions had taken a dip. Thankfully, the Indian coach Anil Kumble stepped into the breach and clarified that strike rate was a factor only for test match bowlers.  This nod of approval seemed to have done his confidence a world of good.  Although, IPL franchisees overlooked him yet again, with perceptions having played some part.

The point remains though—was Pujara’s innings a “slow” effort? Was it selfish of him to grind his way to a double hundred? Did he cost India a victory? Let’s look at the match situation.

The Australian team amassed 451 runs in 137.3 overs taking nearly five sessions away in terms of time. The pitch was good for batting, and there was no guarantee that it would be easy to bowl on in the second dig. Therefore, a good first innings score was essential to minimize the fourth innings target.

To make matters worse, Virat Kohli had injured himself and had spent considerable amount of time getting his injured shoulder treated—despite the team management’s thumbs up, there were no indications about how it would affect his batting. Rahane wasn’t in the best of form despite his crucial fifty in Bengaluru, Karun Nair was a greenhorn with one amazing innings, and the lower order had seen its worst ever collapse in the Pune test. After a second successive bowling pitch at Bengaluru, it is reasonable to assume that the Indian batting wasn’t at its most confident self.

Pujara came into bat at 91/1 in the 32nd over—a comfortable position, but with nearly 9 tricky overs to negotiate. He remained unbeaten scoring 10 runs off 26 balls overnight. The match situation gives a lot of clues about his batting strategy.

Picture1.jpg

Table 1: Innings progression of Pujara’s 202 in the context of the match

The next morning, India began sedately in pursuit of the huge first innings score. Understandably, both batsmen were circumspect and were eager to not give Australia the advantage. His low strike rate is justifiable here. In the second session, Pujara scored 70 runs at a ~75 SR, a far cry from his “slow” image. Note that these runs were scored when India were 193/2, a full 258 runs behind the Australian score. The match situation changed completely by the time tea was taken; India had lost Kohli and Rahane, and were still 148 runs adrift from the target. Pujara was still batting, with the greenhorn Karun Nair for company and a lower order bereft of confidence.

When Ashwin was dismissed at 328/6 in the post-tea session, India were still a long way away from the Australian score. Over the last 5 years, India’s last 4 wickets had averaged 29 runs per tail-ender wicket. An additional 120 runs would have brought parity, but there was no way of knowing how many runs the tail was going to produce in the aftermath of the no-shows at Pune and Bengaluru.

Given all this, the Indian team was fully justified to score at a slow rate. And, since the run rate was low due to parsimonious Australian bowling, the best chance of winning the match was to bat once, and bat big. Therefore, the two wicketless sessions which vaulted India to a no-loss position in the match is great test match batting. Besides, Pujara (12 off 20 balls from 190*, when he could have slowed down to get to the milestone) and India accelerated (RR of 4.54)in the final session, showing great match awareness.

Indian fans may argue that India should have batted faster in the second session; after all, they were only 16 runs in arrears. A gung-ho approach might have worked, but it is worth examining what might have happened if they couldn’t pull it off. A 50 run lead would have yielded nothing in terms of the result; the Australians wouldn’t have batted with the sword of defeat hanging over their heads. In all probability, it would have petered out to a dull draw. Who knows, if Australia had erased the deficit and gone hell-for-leather, India might have had to survive some uncomfortable moments in the manner of the Rajkot test against England.

The assessment of needing 100 overs to get 10 Australian wickets was spot on—over the last five years, the Indian bowling unit averaged 48 balls/ dismissal (or 8 overs). They had even reduced the Australians to 63/4 but couldn’t press home the advantage.

Ever since Dravid retired and Pujara moved to one drop, no number 4 batsman in the world has been coming to the middle to face an older ball. India have been losing their second wicket by the 26th over, until recently. He can crank up his strike rate when needed—his test record has shown that he usually bides his time before accelerating. No wonder Kohli called his contributions under pressure as priceless.

In conclusion, Pujara’s innings kept Australia at bay all through the test match, and gave India a genuine shot of going 2-1 up in the series. To criticize his monumental effort and calling him a one-trick slow pony is a great disservice to his talents, and those arguments do not acknowledge the cricketing circumstances of his knock.

Disclaimer: Some images used in this article are not property of this blog. They have been used for representational purposes only. The copyright, if any, rests with the respective owners.


Can Ashwin become India’s all-rounder?

In late 2003, the Indian U19 team won the Asia under-19 final versus Sri Lanka in Lahore. A certain bowler grabbed three wickets in the final, thus skittling the Lankans for a low score. In fact, this wasn’t his most eye-catching performance during the tournament; he had nabbed nine wickets against Bangladesh.

No, the earlier sentence wasn’t a typo. He outwitted nine batsmen in seven overs and change. That too, in an ODI. In the entire tournament, his wicket tally was nearly three times compared to the second guy. He was a handy batsman too; he had scored 94 runs over 3 dismissed innings. One more decent performance in a Ranji match, and he was on the plane to Australia to play in the 2003-04 tour.

Indian cricketer Irfan Pathan delivers a

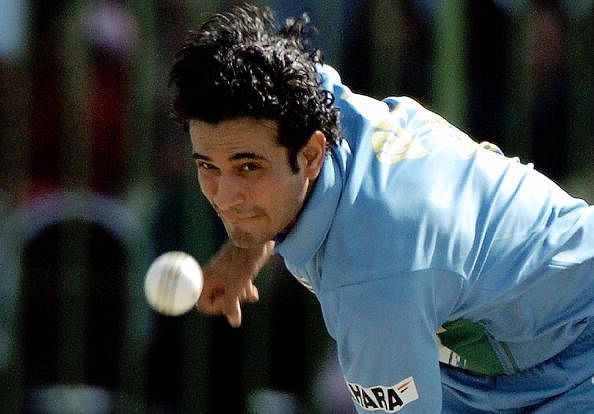
Sultan of swing: Irfan Pathan had an impressive beginning with the Indian team. Image source:1.

In case you hadn’t guessed the protagonist, it was Irfan Pathan. Yes, the same banana-swing-hattrick-hero-pinch-hitter-WorldT20 final MoM-I’ve-regained-my-swing-jhalak-dikhla-jaa-contestant Irfan Pathan. Just when India seemed to get a bowler who could also bat, he seamed and swung no more. A nation which had held its breath in anticipation suddenly exhaled, expressing a collective sigh of yearning.

India had been there before. Agarkar had scored a hundred at Lord’s, India’s fastest ODI fifty, and had gotten to 50 ODI wickets faster than anyone else (stop rolling your eyes). But one tour to Australia had answered the primordial question of which had come first—both the duck and the egg came together when Agarkar was at the crease.

Similarly, an over-enthusiastic commentator had just about invoked a comparision when Laxmi Ratan Shukla bowled his first ever delivery at the international stage. It was a no-ball.

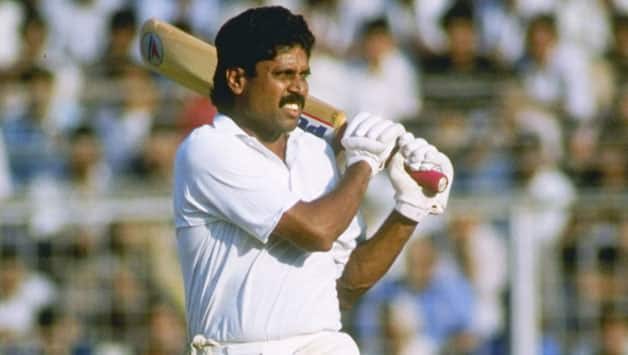
Kapil Dev had spoilt the nation.

kapil-decv

The man for all seasons: Kapil Dev was India’s greatest fast bowler, and a more than handy batsman. Image source: 2.

Kapil Dev was a man who could bowl faster than his run-up; he was a man who could score 175, coming in at 9 for 4; few steps for the man (to catch Richards) was a giant leap for India’s 1983 World cup fluke victorious campaign; he could out-swing England in England; and, smash four sixes in four balls to avert the follow on. In short, Kapil Dev da jawab nahin.

Where the hell was India’s next all-rounder?

Around the same time period that Irfan Pathan was confounding batsmen in Australia, a middle-order batsman took guard at the Chinnaswamy stadium in an under-17 Asia cricket council match in the January of 2004. He would score only four runs, and get dropped in the next match in favour of a young Mumbai batsman—Rohit Sharma.

Fast-forward to 2011, this middle order batsman would make his debut against the West Indies, with Rohit Sharma having to wait on the fringes. He would go on to score his first hundred in only his third match, providing a consolation to the Wankhede crowd who had turned up anticipating Tendulkar’s 100th century (he was out for 94). Oh, he also snared 22 wickets during the series under trying circumstances, by the way—India having conceded the lead twice—en route to being awarded the Man of the Series.

Given how things had turned out in the past, it was perfectly understandable that Indian fans were cautious before making the big proclamation. Me? I was just happy that our off-spinner had grabbed us some wickets.

picture1

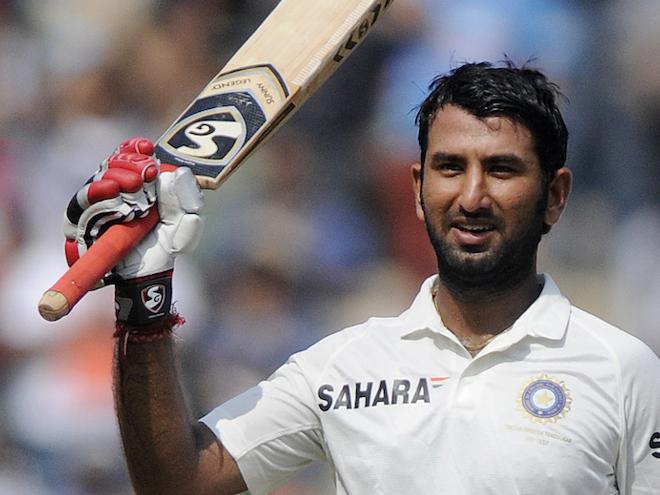
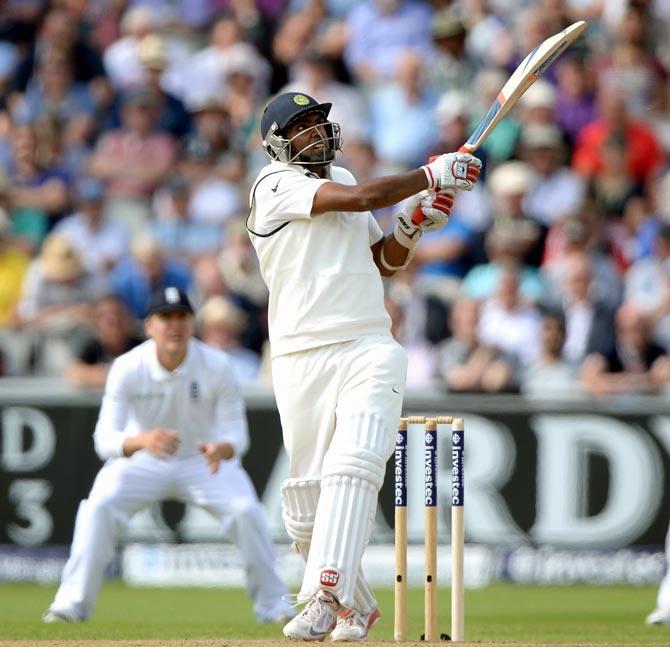
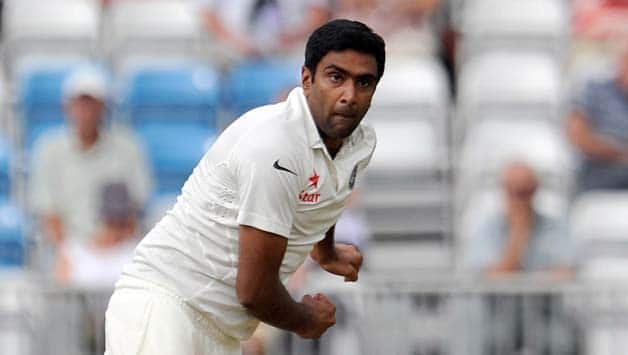
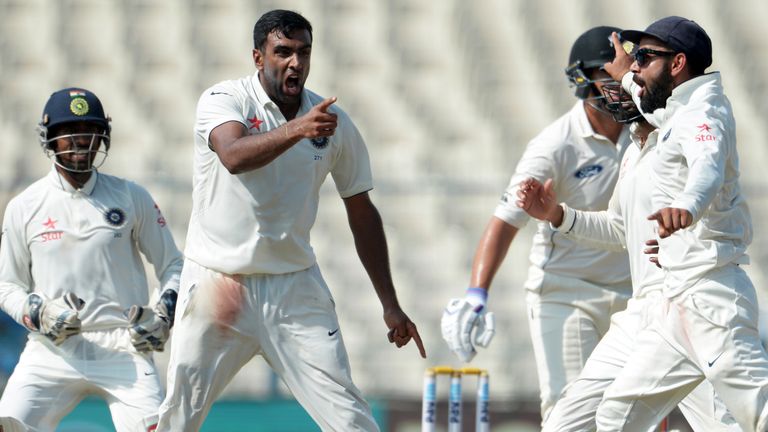
All round mastery: Ashwin has been India’s go-to allrounder over the last 20 months. Image sources: 3 & 4.

Perched firmly at the top of the ICC bowler and all-rounder rankings, it is fair to say that Ashwin has gone from strength to strength over the last 20 months. Is it time to label him as an all-rounder? But what does it mean to be an all-rounder in test cricket? How does Ashwin compare to his illustrious predecessors? Do all all-rounders fulfil the same role? What do the stats say? All stats in this article are from before the first India-Australia test.

In the game of test cricket, the possession of the all-rounder is a highly coveted, yet elusive one. There are only a handful of individuals who have claimed significant levels of mastery over two skill sets, namely batting and bowling. Loosely, an all-rounder is defined as someone who can bat in the top six, and can contribute as a match-winning bowler.

The often quoted gold standard demonstration of all-round skills is the 1981 Ashes (famously dubbed Botham’s Ashes), where Ian Botham topped both the batting and bowling charts for England with 399 runs and 34 wickets. In terms of long term excellence, there isn’t a finer example than Imran Khan averaging over 50 with the bat and under 20 with the ball over the course of 52 matches spanning a decade. Normally, either one of the statistical measures would be sufficient for world-class pedigree, leave alone two. For what it’s worth, Ashwin had measures of >43 and <24 respectively in 2016. Baby steps, still.

1.jpg

Table 1: List of all rounders with their career batting and bowling statistics.

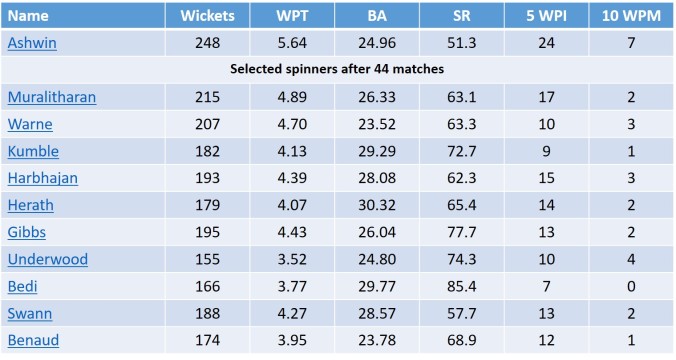
Over the history of test cricket, only a handful of players have been bracketed as all-rounders. The above list contains some of the most famous names of the sport. All the above players have crossed a certain minimum threshold: 45 test matches, 2500 runs, 150 wickets and a positive average difference. Unfortunately, for various reasons, I had to leave out some illustrious names such as Aubrey Faulkner, Tony Greig, Richie Benaud, Chris Cairns, Vinoo Mankad and others. Over the course of this article, we will be taking a close look at Ashwin’s career progression and team role, vis-à-vis his counterparts.

A good way to capture the career progression would be to look at the real time advancement of various cricketing metrics. A note of caution, though: since these are real-time, cumulative figures, the perturbations later in the career would be much smaller due to the benefit of a larger cushion. A simplistic example to illustrate this point would be to state that 1 month is 8.33% of a 1-year old’s lifetime, but is only ~0.5% of a 16-year old. Hence, due to the “streaky” nature of early career statistics, the values from the first 10 innings/tests have not been represented (but have been included) in some graphs (these have been clearly mentioned under each figure caption).

In most graphs, for the sake of easier visualization, the data has been represented in a split-window approach of two graphs side by side, each containing the data of five players; the data points of each player have been colour coded as per traditional national team jersey colours of the shorter formats.

First up, would be various measures of batting ability. In the test format, batsmen are measured by their run-making contribution.

2.jpg

Figure 1: Real-time progression of batting average with each test. To minimize appearance of streaky data, points from the first 10 tests have not been shown.

The traditional favourite metric of batting ability is the batting average (runs scored per dismissal). Historically, a batting average of 50 is opined to be a measure of all-time greatness. Only two players from the all-rounder list have breached this benchmark, following contrasting paths: Sobers reaching it quite early, and Kallis achieving it only by his ~70th test. Imran’s late career showing is captured by his ever increasing trajectory. The others hover between the 27 to 40 marks.

However, is it fair to compare a lower order batsman with a top order one? Wouldn’t a top order batsman have a greater chance of making more runs since he can call upon greater batting support? Valid question.

3.jpg

Table 2: Average batting position of each all-rounder

The first deviation between the definition of the all-rounder and career statistics appear in the average batting position (ABP). Sobers, Kallis, Miller and Shakib batted in the top 6; the rest batted mainly at 6 and below. Ashwin’s average batting position belies his recent stint at number 6—his career-to-date ABP is closer to Hadlee’s and Pollock’s.

It must also be noted that the ABP only represents an average. One could mischievously conjure an ABP of 5 with an equal number of innings at numbers 4 and 6 (and none at 5). Hence, in order to take these values in context, the batting position spread has to be investigated as well.

4.jpg

Figure 2: Percentage breakup of innings played at each batting position

If the percentage spread of innings at every position is examined for each player, more trends emerge: Kallis predominantly batted at 3 & 4, Miller at 4 & 5, and Shakib at 5 & 6; Sobers batted all around the batting order, favouring the number 6 position the most. Perhaps, some of Hadlee’s lower batting average can be attributed to his stints at 8 & 9. In Sobers’ case, the ABP does not correlate with his most frequent batting position.

5.jpg

Figure 3: Real-time progression of average batting position (ABP) with each innings

The real-time progression of ABP also gives great insight about the batting roles played by these all-rounders at different points of time in their careers. Kallis and Miller quickly transformed to middle order batsmen; Imran, Shakib and Hadlee gradually batted one position up the order; Kapil, Pollock and Botham were steady presences in the eleven. Sobers is the one genuine outlier amongst this bunch: he started much lower down the order, worked his way up, and then approached an ABP of 5 towards the end of his career.

From the various batting metrics garnered from the scorecards, it can be confidently said that Sobers, Kallis, Miller and Shakib neatly fit into the definition of top 6 batsmen. The rest batted lower down the order. On the basis of the above data, it can be said that Kapil, Pollock, Ashwin and Hadlee were bowlers who could bat a bit.

However, a complete picture of their all-round credentials can only be obtained after examining bowling statistics as well. The most important statistic for a bowler is the number of wickets. Compared to the runs, wickets are comparably finite (20 in a test match). Hence, auxiliary support needs to be drawn from other information contained in scorecards—such as balls bowled, runs conceded, and bowling position.

Similar to the batting average, the bowling average is a measure of the bowling ability (runs conceded/wicket taken). It must be noted that this is a good measure as it is the product of the economy rate (runs conceded/balls) and the strike rate (balls/wicket taken). An all-time great bowler typically boasts of a bowling average in the sub-30 mark (with the top pace bowlers hovering around 20).

6.jpg

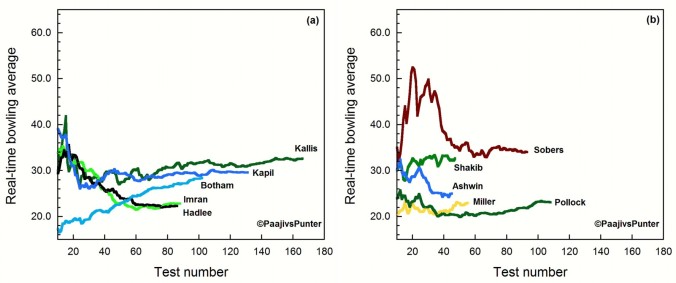
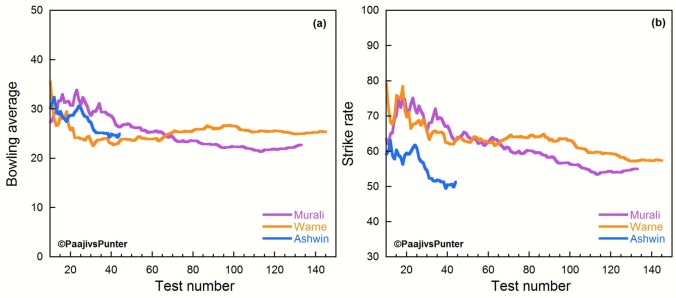
Figure 4: Real-time progression of bowling average with each test. To minimize appearance of streaky data, points from the first 10 tests have not been shown.

The career progress of bowling average charts a totally different journey for many players. Kapil, Kallis, Miller and Pollock have relatively consistent late careers; Botham had a spectacular debut and his performance kept deteriorating with time; Imran and Hadlee went the other way, almost following the same path of improvement. Sobers had an ordinary start, struggled, and then found his footing after his ~40th test. The recent improvement in Ashwin’s statistics is quite visible with a reduction in his bowling average. From a standpoint of bowling average alone, Hadlee, Imran, Ashwin, Pollock and Miller have shown great bowling credentials to date.

7.jpg

Table 3: Average bowling position of each all-rounder

Like the batting counterpart, the Average bowling position (ABoP) of each all-rounder reveals some details about their role within the team. Typically, a team has 4-5 designated bowlers (usually 4). The bowling attack is mostly led by a fast-bowling pair, followed by a first change bowler and a spinner. The first change bowler could be another fast bowler or spinner based on the conditions (3-1 or 2-2 combination). Often, spinners are ploughing a lone furrow from one end while the fast bowlers are rotated from another. Generally, spinners tend to bowl longer spells, and are less effective at taking wickets (on a runs conceded/wicket or balls/wicket basis), but typically grab more wickets per test.

From the ABoP, it can be seen that Imran, Kapil, Pollock and Hadlee were the ones who were given the first use of the cherry; Miller’s and Botham’s numbers resemble first-change bowlers; Ashwin has been the lead spinner and Shakib is the second spinner. Kallis was the 4th seamer—a rough indication of his role in the team. It may seem that Sobers was not as important as some of the others from a bowling perspective, but there is a minor wrinkle in his ABoP value of ~3.5.

8.jpg

Figure 5: Percentage breakup of innings bowled at a particular bowling position. Note that percentage of innings not bowled in (DNB) has also been shown.

The percentage spread of bowling position resolves the issue of Sobers. It must be remembered that Gary Sobers was capable of bowling in a variety of styles (pace and spin), and hence his appearance in the bowling order is quite spread out. He has bowled at the top 2 slots for ~20% of his career.

The above plots confirm the places of Kapil, Hadlee, Imran and Pollock as new ball bowlers; Miller too, has operated with the new-ball ~70% of the time, unlike the ABoP stat, which showed his position to be ~2.3; Botham bowled mainly between 2 and 4. Shakib and Ashwin feature much later due to the fact of them being spinners. Kallis didn’t bowl in ~15% of innings, and bowled behind 3 seamers for more than 60% of his bowling career (with negligible innings at 1 or 2).

9.jpg

Figure 6: Real-time progression of average bowling position with each innings

The plots of real-time ABoP separate the bowling claims played by the various all-rounders. In the 1980s, everyone except Botham were the top gun bowler for their respective teams. Sobers’ bowling chops are reflected in his continually improving ABoP. At best, Kallis was the fourth seamer for his team. As it has been discussed elsewhere, he was primarily a batsman who bowled really well. Ashwin and Shakib have been important spinners for their sides.

10.jpg

Figure 7: Real-time progression of Wickets per test. To minimize streaky appearance of data, points from the first 10 tests have not been shown.

The time-lapse data of wickets per test (WPT) further strengthens the earlier findings: Botham regressed in his wicket-taking ability from his initial high, and Hadlee and Sobers improved to a great degree. Kapil and Pollock had productive, stable careers. In spite of Imran bettering his career average, his wickets per test declined—probably indicating that he bowled much lesser later on in his career. Kallis’ secondary role is confirmed with his WPT value being the lowest amongst the lot.  Ashwin, in his short career, has seen many ups and downs.

11.jpg

Figure 8: Real-time progression of balls bowled per test. To minimize the appearance of streaky data, points from the first 10 tests have not been shown.

The real-time balls per test (BPT), too, follow earlier trends. Kallis had a far lesser BPT (~50%) compared to the bowling load of the other players. On this basis, he could be labelled as a batsman who could bowl well rather than an all-rounder in the truest sense. Even though his statistics are quite similar to Sobers, his bowling workload was never in the same league. Every other all-rounder averaged at least ~180 balls per test. In spite of Shakib being a spinner, his BPT is close compared to the other pace bowling all-rounders—this points to Bangladesh not burdening him with heavy bowling responsibilities. Ashwin’s recent BPT values have improved due to his wicket-taking feats.

12.JPG

Figure 9: Representation of interruption in bowling duties for each all-rounder

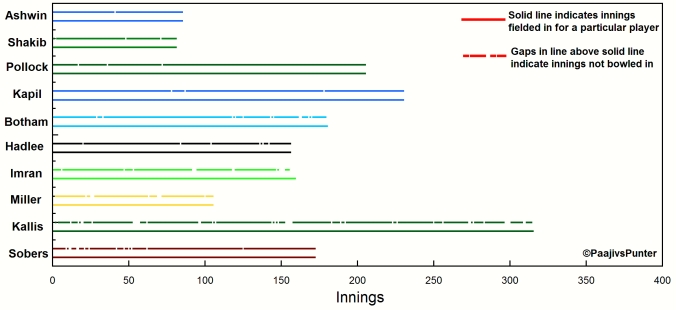
The temporal spread of innings bowled in for each player can be visualized in the above plot. Each solid line indicates the length of bowling career for each player; the line above the solid line contains many gaps, each indicating an interruption in bowling duties. From the above plot, the extent of Sobers’ bowling load is clear; as is the case with almost all the others. Kallis did not bowl for significantly long periods of time, and Imran did not bowl near the end of his career.

How about putting both the skills sets together?

The currency of a test match is runs/wicket. Given than a team has to necessarily capture 20 wickets to win the match, it follows that a winning team will end up with a positive runs/wicket differential w.r.t to the losing team (a declaration would still count as forfeiting the remaining wickets). In a sense, this number plays a similar role to Goal Difference in football.

Therefore, both the batting and bowling contributions are represented by the respective averages—which are essentially runs/wicket. For an all-rounder, the difference between the batting and bowling contributions gives an indication of his net value to the team. This can either be expressed either as a difference or as a ratio.

13.jpg

Figure 10: Real-time progression of (Batting average-Bowling average) with each test. To minimize streaky appearance of data, points from the first 10 tests have not been shown.

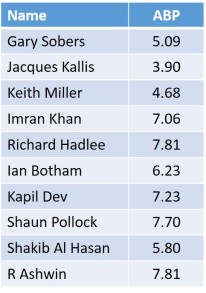
Test match all-rounders are often measured on the differences between their batting and bowling averages. In a way, they indicate their net contribution to the team. A lot of all-rounders took their time to come to the positive end of the plot. Botham started off as an all-round statistical wonder before finishing with decent numbers overall. Only Kallis and Sobers boasted of a 20+ average difference, but as we’ve seen earlier, the differences in their team roles couldn’t be starker.

14.jpg

Figure 11: Real-time progression of (Batting average/Bowling average) with each test. To minimize streaky appearance of data, points from the first 10 tests have not been shown.

Another (uncommon) way of expressing their contribution is to take a ratio of the two averages. A ratio would yield a dimensionless number, and would favour the better bowlers more due to the lesser denominator. A plot of this reveals that only 4 players—Imran, Miller, Sobers and Kallis finished with a ratio of 1.5.

So, who fits the bill as the all-rounder in the most traditional sense?

15.jpg

Table 4: Values of ABP, ABoP and the adjusted sum for the given all-rounders. The Adjusted sum is the sum of the ABP and ABoP. *Note that corrections have been applied in the cases of Ashwin, Shakib (-2) and Sobers (-1) for better representation.


It must be noted that while there are all-rounders in ODIs who have opened both the batting and bowling consistently (Zimbabwe’s Neil Johnson comes to mind), the fast-bowling workload is quite immense in tests, and hence examples of all-rounders who batted up the order are hard to come by. One way of checking their importance to the team would be to sum up their average batting and bowling positions. Since spinners bowl later, a correction of -2 has been applied (-1 for Sobers, considering his bowling variety) to get an adjusted sum.

16.JPG

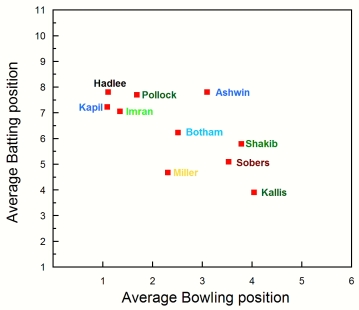
Figure 12: Representation of ABP versus ABoP for various all-rounders. Note that the correction has not been applied in the spinners’ cases.

Going by the average batting and bowling positions, and the adjusted sum values, Keith Miller fits the definition the most, followed by Sobers. Over years to come, Shakib has a great chance to join this clan due to his middle order batting position (and provided he can be effective as a bowler). What about Ashwin then?

The above plot also shows Ashwin’s value to the team—being the team’s leading bowler (like Kapil, Imran, Hadlee and Pollock). Ashwin might have been the only fifth man to score 300 runs and take 25 wickets in a series, and one of four men to tally the 600 runs-60 wickets calendar year double (with Botham being the other common factor in these two lists); Ashwin might have had a recent fantastic stint at number 6, but he wouldn’t figure any higher up in the batting order even if he were to score 5 more hundreds in 2017. However, he would probably be dropped to make way for another spinner should he continuously perform poorly with the ball for a series or two.

17.jpg

Figure 13: A snapshot of the various all-rounders’ career statistics after 45 tests.

In his relatively short career, Ashwin has shown great all-round credentials and is well placed ahead of many legends around the 45 test mark on many metrics. He has the highest wickets, WPT, five fors, and has the best batting stats when compared to others who batted primarily at number 7 or lower (Kapil, Imran, Hadlee, and Pollock). However, whether he follows the path of Ian Botham or Imran Khan remains to be seen.

Ashwin, being a spinner, has a great chance of a longer career compared to pace-bowling all-rounders. With a longer stint at number 6, he may even get to post higher scores as a batsman. With a little bit of help from the Indian pacers, he should be able to perform better abroad. He has a genuine shot at becoming the premier spin-bowling all-rounder of all time; but, his all-time status and legacy will heavily hinge on what he does with the ball.

Disclaimer: Some of the images used in this article are not property of this blog. They have been used for representational purposes only. The copyright, if any, rests with the respective owners.


Why can’t the BCCI play big brother?

Ranji_trophy.jpg

Domestic bliss: Why can’t the BCCI invite nearby national teams to add to the Ranji trophy? Image source: 1.

With great power comes great responsibility.

As clichéd and overused as this phrase is, it rings true in case of BCCI in the cricketing world. BCCI is easily the most powerful cricketing board and stands above all its peers. This is in no small part due to India being the largest cricketing fan base.

However, cricket is not a popular game most countries around the world. In fact, there are only ten full members in ICC out of the total 105 countries registered. Out of these 10 teams, four of them are from the Indian subcontinent. There are two representatives each from Oceania and Africa, a solitary team each from North America and Europe and none from South America.

The rest of the teams are either Associates or Affiliate members. To qualify as an Associate or an Affiliate team, there exist certain conditions on the organizational structure and the level of cricket infrastructure. In order to qualify as a full member, the team performance must also be good over and above the organizational and infrastructural requirements. It is not easy for the associate teams to break this glass ceiling and make the jump to the full member status. The last time this happened was 17 years ago when Bangladesh were awarded the test status in 2000.

They were woefully underprepared when they were given the opportunity as they did not have any structured multi-day competition in 1999, one year before their test debut. They may have been derided for their lack of results in the test scene, but their recent victory against England needs to be seen from the viewpoint of an underdog getting a spectacular result against a team which had a 200 year head start over them in cricket.

If the sport needs to grow beyond the confines of the existing hegemony, there needs to be significant strengthening of the so called “Tier-B” teams. The BCCI, being a very powerful organization should consider it their responsibility to not only help popularize the sport in newer countries, but also help the countries who want to make the step up. To this end, it would be a positive move to consider the addition of teams from Afghanistan and Nepal into the Ranji trophy.

Both Nepal and Afghanistan are Associate members at ICC. Afghanistan also holds the temporary ODI and T20I status granted by ICC. Nepal held the T20I status temporarily before losing it in 2015. This goes to show that they are among the top Associate teams, and with some help can tremendously improve their chances of playing test cricket.

The BCCI has previously come to the aid of the Afghanistan and Nepali cricket in different ways. At the end of last year, the BCCI signed an MoU which would allow Afghanistan to play its home matches against other associate teams and full member A teams at the Shahid Vijay Singh Pathik Sports Complex in Noida. BCCI had also opened the doors to its training facility and technical expertise to Nepali cricketers after a major earthquake devastated Nepal in 2015.

But neither of these countries have been invited to join the domestic competitions in India.

This would not be the first instance of a country allowing teams from other countries to participate in its domestic competition. The practice is prevalent across multiple sports and the teams from the “smaller” countries have reaped the benefits of playing in a better competition.

An example from the footballing world which would spring to mind immediately would be the Welsh clubs like Swansea City and Cardiff City playing in the English football league system. Swansea in particular have been extremely successful, currently plying their trade in the top tier of English football, the English Premier League and also having qualified for a European competition in 2013 after winning the English League Cup.

In Rugby, Argentinian team Pampas XV participated in the South African second domestic competition for 4 years. This team consisted entirely of members who were a part of the High Performance Plan of the Argentinian Rugby Union. This team served as the backup to the Argentinian national rugby team.

USA and Canada have a very fruitful relationship in this regard where the Canadian teams from multiple sports like Basketball, Baseball, Ice Hockey etc. take part in the US domestic competitions.

In cricket, the blurring of lines between the teams of different countries for a domestic tournament have been far fewer. The Indian domestic tournaments have tried and abandoned a few such attempts. For a few years in the 2000s, the Duleep trophy in India which is traditionally held between the five zones from India included a foreign guest team to compete as the sixth team. The sixth team usually was a second tier team from a strong country or a first tier team from a low ranking full member.

Another such example would be the M J Gopalan trophy. This was an annual first class competition played between Ceylon Cricket Association (Sri Lanka) and Madras primarily between 1952 and 1982, easing Sri Lanka’s journey from an associate member to a full member with test status.

With ICC recently announcing changes to the Test and ODI calendars, the “associate” teams have a chance to play against the big boys—probably taking the place of warm up games for tests against other opponents in the same region. Taking a lesson from Bangladesh’s journey, the bigger countries should go one step ahead and nurture a first class structure to ease the associates’ journey.

Maybe the time has come to break the norm, and try a policy of inclusion for the teams from the associate countries to compete at the first class level with the teams of the full members. Both Ireland and Scotland have mentioned that they would welcome the chance to join the English county championship. The ECB is still considering whether to expand their 18 team competition to a 21 team competition with three divisions of seven. Afghanistan and Nepal would probably accept such an invitation from BCCI with open arms.

Of course, these procedures will involve reshaping the existing tournaments a little to fit in additional teams. And there will also be the question of at what level these teams need to be included (. But these are details which can be ironed out easily the Ranji trophy has 3 groups of varying difficulty) keeping the bigger picture in mind. The eventual aim of this exercise would be to empower the teams from these countries and establish a good first class structure in their home country.

The progress of these teams in the first class competitions would also help the ICC in making decisions about providing full membership to these countries instead of relying upon their performances in tournaments which happen once in four years.

For many years now, cricket has been a stronghold of a handful of countries with the others just looking in. For the betterment of the game this needs to change, and it would bode well if the first step towards this was taken by the BCCI.

Disclaimer: The image used in this article is not the property of this blog. The copyright, if any, rests with the respective owners.

Testing times for test cricket

ICC_logo.svg.png

Changes afoot: A new test league is due to come into place after the ICC Meeting in Dubai. Image source: 1.

Recently, the Chief Executives committee (CEC) met up in Dubai to decide the fate of the international cricket calendar. In one swift move, it has suggested sweeping changes to the international calendar, and one that could have far-reaching implications. The main purpose behind such a move seems to be rooted behind two motives: one, to provide “context” to every cricket match, culminating in a championship—à la other league based organized sports; and two, to provide some set of fixtures for the “lower” teams, and a promise of advancing through the ranks. While both claims are debatable considering the implementation issues, it is worth examining what caused the proposal to take this form over time, especially with respect to test cricket.

In 2009, the ICC called a meeting to discuss the idea of a World Test Championship. Cricket is particularly an oddball when it comes to the highest team honour of the game. The most prestigious team trophy in World cricket would be the ODI World Cup. With the advent of the popular T20 format, another World cup joined the fray. These “World level” showpiece events draw attention from outsiders, and give a chance for fans to soak in the atmosphere. Many of us in India jumped on the footballing bandwagon during the World cups, before moving on to follow club-level football on a regular basis.

Instead, the most prestigious contests in test cricket are bilateral series, which is hard to explain to an outsider and doesn’t have the same zing as a “World Test Championship”. In spite of test cricket being the original format of the game, it didn’t have a showpiece tournament of its own. What chance did test cricket have to add on to its followers?

Isn’t this odd?

This is where things get a bit murky. The ODI World cup is on a 4 year cycle. The Champions trophy was held once every two years till 2006; once the World T20 came along, and took the cricketing world by storm, it was shifted to a 4 year cycle (with the World T20 being staged every 2 years). Now, all 4 slots for international tournaments have been filled shut.

One of the complaints about the premier World Cup tournament was that it had become a bloated circus, with the initial rounds holding little interest; that the Champions trophy was held only between the top-8 ODI cricketing nations didn’t help matters either.  It was weird that the less prestigious tournament had “better” cricketing contests and was “refreshing” compared to the World Cup. We don’t see these complaints in, say, tennis, do we? That a year-end tournament or Masters is better to watch compared to the Grand Slam?

With this in mind, the ICC approved the World Test Championship in 2010. Along with it, it also resolved to shorten the ODI tournament, enlarge the World T20, and have a one-day cricket league. Since the ODI format had two tournaments in the four year cycle, the Champions trophy seemed to be on the chopping block. There was a false start in 2013, but it was decided that by 2017, the World Test Championship would replace the Champions trophy.

This is when things got even more interesting.

prv_20130623_2039_21520.jpg

We are the Champions: The commercial success of the Champions trophy gave it a new lease of life after India lifted the trophy in 2013. Image source: 2.

The (then last) 2013 Champions trophy was a resounding success. The numbers were bound to be good, with India winning it. The World Test Championship now ran into serious problems at the multiple levels.

One of the biggest problems (and charms) of test cricket is its uncertainity. Test matches are supposed to last five days, and very often they finish well before the scheduled finish. At one point of time, players were not paid for the fifth day when the match finished early.

What happens to spectators who buy tickets for the fifth day (there is a refund policy in some places)? What happens to broadcasters who’ve bought ad slots for astronomical sums, but now there are no eyeballs on TV? What would be the format of the test championship? One-off test? Series? Home or away? Location? Which team progresses in the case of a draw? Imagine the scale of confusion when one of the ideas suggested was to play the final in a timeless format.

If the 1939 match was cast aside as a draw since the England team had to catch the boat back home, and the format abandoned due to scheduling and commercial aspects, what chance did this idea have in this era of 140 characters? When the Champions trophy succeeded, it was an easy choice to make. Back to square one again.

The ICC has now proposed a 2 year league system, but it must understand that test cricket is in danger. Just recently, it was revealed that 19 out of the top 20 programs (not just sports programs, mind you) in India were T20 games (both international and IPL).  What was worrying was that Test cricket in India was on a downward viewership spiral, and T20 was on the rise (in spite of viewer fatigue and paucity of test cricket). All said and done, the T20 format is a limited one—where one does not have to dismiss the side in order to win the match. Granted, the compromise of limited overs over dismissing a side for victory was started by the ODI; but, what it has done is to diminish the value of the bowler—the one who can dismiss the batsman who has no compulsion to score. Eventually, the money will talk.

Perhaps, the glib attitude to test cricket comes down to the very findings of the Stuart Robertson-ECB survey in 2001, which led to the birth of the T20: that cricket was viewed as a sport of the elites, out of tune with modern temporal demands; young fans were not picking up the game, there was dwindling viewership and cricket was ceding ground to football.

Though this may not be music to test match cricket fans (like me), we have to accept that T20 is the only format which is in tune with our day jobs. Who can afford to take a five day holiday to watch one match of test cricket? It isn’t a surprise that the test summer schedule in traditional bastions like England and Australia have hence been invaded by domestic T20 tournaments.

Credit must be given to T20 cricket for giving a formula to make fans flock to a stadium/TV to watch domestic cricket. And, a leaf can be taken from their book as well. In order for test cricket to survive and thrive, it needs to be played actively by many teams of high skill, in a close set of matches. It is perhaps time for test cricket to be subsidized by a franchise level, league and knockout, 3-format cricket alongside international matches. Intra-national cricketing logistics would be far simpler to handle compared to international matches.

Conceivably, if the franchises were to compete for a grand prize where test cricket results contribute majorly to the points, and if their right to play the top-level, money spinner T20 format is threatened by relegation, no type of cricketing skill would be neglected.

Disclaimer: The images used are not property of this blog. The copyright, if any, rests with the respective owners.


Problems with the newly proposed test league

icc-board-meet-getty-630.jpg

The Big Three rollback: ICC announced sweeping changes to its revenue distribution and international fixtures in its recent meeting. Image source:1.

At the end of last week, the Chief Executives Committee of the ICC met up in Dubai. At the end of their two day meeting, they came up with a radical proposal to change the framework of the international calendar. Of course, it wasn’t the big ticket item of discussion which dominated the headlines; that would be the dismantling of the “Big Three” proposal. This piece of news didn’t dominate the headlines as much, but has wide ranging ramifications for the way the game will be played once the new schedule comes into effect.

One of the topmost items on every cricket fan and players’ wish lists was a fixture list which provided “context”. Take for instance, football. Barring the Olympic Games, there are mainly three types of fixtures on the international scene—the friendly, the qualifying tournament, and the big tournament. Nowadays, the handful international friendlies are often viewed as an annoying moratorium on club matches. They only serve the purpose of trying out new players, and raking in the moolah in the case of a marquee fixture in a foreign land (say, Brazil vs Argentina in America). Each of the other games have a relevance in terms of the big prize—The World cup, The Euro and their ilk (although they have lost their sheen to the Champions league recently, but that is another discussion altogether).

In contrast, cricket banks on several meaningless (especially ODI) series, which only seem to serve the purpose of plugging in sponsors and getting some ranking points. In fact, these didn’t have a major consequence until recently (West Indies have not made the 2017 Champions trophy cut).

On the face of it, this sounds like a plan with its heart in the right place with respect to test cricket: 9 teams play each other over a period of two years, culminating with a playoff between the top two teams. The lower ranked teams (Zimbabwe, Ireland and Afghanistan) are not ignored either—each “top” team would play at least one “lower” team during the cycle.

For a league to be fair, each team has to face every other twice (once home and once away)—just like the current four year FTP cycle. This means that each team needs to play the eight teams over a minimum of 16 test matches over two years. Not much of a lifestyle change from the current fixture list. The 13 team ODI league is also doable. So far, so good.

However, when one crunches the numbers, it is easy to see that the implementation of the test match schedules is fraught with uncertainity. Factor into the travel considerations, and this is where things start to get a wee bit crazy. The ICC has defined a tour as at least one match. Would a board send its team half way across the world for just one test match? Remember, the last time when India toured South Africa, a two-test series didn’t exactly whet the appetite. Even if all teams play two test matches against each other home and away, it makes it 16(!) tests for a calendar year. Throw in one more test for the “lower” teams, and fixtures from two more formats you know how unrealistic this schedule sounds.

The ICC has factored this to its credit, and has stipulated that the two consecutive two year test cycles would be complements of each other. That is, if India tours Sri Lanka in one, the reverse fixture would happen in the next cycle. This is what is followed in the Ranji trophy, and the Europa league. But would this provide parity to all teams when a prestigious, yet-to-be-constituted trophy is at stake?

Then there is the problem of number of match-ups: The IPL has 14 matches for each team in the league phase, the EPL—38. Here, teams are free to decide the length of a tour bilaterally. How would you equate a 5 test series with a 2 test series?  Can a short test series be fair considering teams may not be able to acclimatize easily? What happens if India refuses to play Pakistan? How many points will it be docked? More importantly, how will the results be taken into account considering that home teams have won at home more often recently than every other decade barring the 1870s? By the way, the 1870s had only three matches.

In fact, the damning blow to this arrangement could come in the form of the actual schedule itself. Out of the 9 countries, England are on an April-September schedule, West Indies are on a March-August timetable, and the rest follow an October-March calendar.

Typically, a test team hosts two teams and tours two countries during a year. England wouldn’t be able to tour West Indies in the second half as it would clash with its own home season—it would not be able to host one team at home in that case. If you thought this was bad, spare a thought for the West Indies. They compete with 7 countries in March; with the IPL in April-May; and with England in June-August.

With all this thrown in, when will the ICC have the playoff? In June at Lord’s? Or would it ignore its mythology and its primacy altogether by hosting it at the end of the calendar year in one of the 7 countries? Will a crowd turn up to watch a “neutral” test match in any part of the world?

All things considered, this model raises more questions than answers.

Disclaimer: The images used are not property of this blog. The copyright, if any, rests with the respective owners.

The spin doctor

In the lead up to India’s 500th test match in Kanpur, various print and online media outlets ran their own all-time India XI compilation articles: Espncricinfo to India Today, Wisden to The Hindu. Most of the squad members selected themselves, except for a couple of surprises. While there was general consensus that it was too early to consider Virat Kohli for an all-time XI (which is totally understandable), there were no murmurs that Ravichandran Ashwin made it to a few teams. Granted, India has always been a batting obsessed country but the spin cupboard was not barren either; India’s had a proud tradition from the days of Subhash Gupte, but that didn’t prevent Ashwin from being selected ahead of legends of days past. This is a testament to some of his achievements and current standing in world cricket.

0

Ahead of the pack: Ashwin has rapidly vaulted himself into all-time Indian XI slot contention with his recent showings. Image source: 1.

Ashwin has been the talk of the town ever since he remodelled his action; he has taken wickets by the bucket loads and his accomplishments over the last two years have been astonishing, by any yardstick (snide remarks by ex-India players aside). His appetite for wickets has been all too well documented. He is the first Indian bowler to breach the hallowed 900 level in the ICC rankings (similarly, only Gavaskar has crossed the mark amongst Indian batsmen). No other Indian bowler in history is in his vicinity with respect to the ICC ranking points. Hence, the aim of this article is to delve deeper into Ashwin’s standing amongst his peers and cast a critical eye on overseas records of spinners. Does Ashwin have a shot at all-time greatness à la Warne or Muralitharan?

First, we have to set the stage to understand the statistical perspective of a spinner’s canvas. For the purposes of this article, only test matches from 1 Jan 1946 to 20 Dec 2016 will be considered. Let us now proceed to see some popular measures used in cricket to quantify a bowler’s performance.

Strike rate (SR): Deliveries bowled/dismissal

Economy rate (ER): Runs conceded/six deliveries bowled

Bowling average (BA): Runs conceded/dismissal

Wickets per test (WPT): Wickets taken/number of tests played in.

Hence, it can be see that the Bowling average contains information about the Economy rate and Strike rate. Since it is a product of the two, a good (low) bowling average implies low values of the ER and SR. Therefore, we will primarily be using the BA as the first level filter; additional details will be obtained from SR and WPT wherever necessary. All the tables containing the statistics in this article can be downloaded from this link.

1

Fig. 1: Statistics of subcontinental spinners, ordered by total wickets for country. The leader in each column has been marked in bold.

We can now proceed to examine Ashwin’s record amongst his peers from the countries which boast of a spin-bowling tradition. He tops the table in SR, comes second in BA and bowls 45 balls/test lesser than Ajmal and Murali. That Muralitharan towers over the rest is quite evident from his statistics; he ranks first or second in every parameter. Amongst these spin legends, it is safe to say that his trajectory is moving towards Muralitharan.

2

Fig. 2: Comparision of Ashwin’s record against selected spinners’, after the 44 test mark

The extent of Ashwin’s records to date have to be assimilated by understanding the kind of start he has had. No other spinner since World War 2 has grabbed so many wickets in his first 44 matches. Ashwin is in a class of his own with respect to WPT, SR, 5 wickets per innings and 10 Wickets per match. From the above table, it is also easy to see how Murali tipped Harbhajan to break his records. Unfortunately for India, Harbhajan could not kick on from the start he got. At the 44 test stage, Warne and Muralitharan were in a class of their own. Hence, it is imperative to look at the Ashwin’s career trajectory with respect to these two legends.

3

Figs. 3: Variation of Career to date values of (a) Overs per test and (b) Wickets per test for the three bowlers.

The above plots of (a) Overs per test and (b) Wickets per test (WPT) are a progression of the cumulative real-time values. Meaning, the tallies at the end of every match are divided by the number of tests played to get an idea of how the player’s career performance statistics moved with time. To put it another way, these are career to date figures at the end of each test.

At the start, the perturbations to the values are quite large as the number of tests played is quite small. For these plots, the data for the first 10 tests have been taken into account but not shown to avoid the large spikes at the start of everyone’s career. Over time, the plots smoothen and all the values finish at the end of career values (for Murali and Warne). It also follows that creating a larger perturbation is relatively difficult at the end of the career due to the weight of the statistics to date.

From the graphs, it can be noticed that the two legends’ careers moved a bit differently. Both legends needed about 30 tests to get a grip of international cricket. Murali bowled significantly more overs after the 30 test mark, and got more wickets as well. Warne, on the other hand, bowled fewer overs (presumably, as he had to share them with a better set of teammates) but this did not impact his ability to take wickets majorly; his resurgence after the 100 test mark is an achievement in itself. Ashwin’s fortunes have taken an upswing after 25 tests and has bowled lesser overs per test. Perhaps it is more to do with his strike rate, as he has cleaned up sides faster than any spinner since World War 2.

4

Fig. 4: Comparision of Ashwin’s current wicket taking streak with Muralitharan’s peak

Can Ashwin overhaul Muralitharan’s tally? It will go down to how long Ashwin can keep his current wicket-taking streak going. In 20 test matches since 1st Feb 2015, Ashwin has captured 129 wickets at 19.69 runs/wicket, which is an unbelievable streak. Not considering Muralitharan, that is. The Sri Lankan had a streak four times as long, stretching a scarcely believable 79 test matches: 7.15 WPT, 565 wickets at less than 19 runs/wicket.

5

Fig. 5: Hypothetical progression of Ashwin’s career wicket tally with respect to Warne and Murali’s careers, at different wicket taking rates.

If Ashwin continues at 6 WPT, he can reach Murali’s mark of 800 around the 136th test mark (provided he plays for so long). India has typically played 8-10 test matches per year and he would be needing a decade of performing at this level in order to overcome that barrier. He will still reach respectable tallies if he can only muster 4-5 WPT instead.

6

Figs. 6: Variation of Career to date values of (a) Bowling average and (b) Strike rate for the three bowlers.

The career to date (a) Bowling Average and (b) Strike Rate graphs also throw up similar trends to WPT. Muralitharan continuously improved his stats from the 30th test matches till almost the end of his career. Warne had a relatively steady career in terms of his statistics after the initial 30 matches. Ashwin’s strike rate was hovering around 60 balls/ dismissal but his showing in the last 20 test matches has got it to all-time great fast bowler territory. These plots only confirm Ashwin’s progress in the last 2 years or so, but much of his legacy will be dependent on how he is able to perform at this level, and how he bowls overseas (Aus, NZ, SA and Eng).

Ashwin has been rightly criticized for his showing outside the subcontinent before 2015. But what about his recent performances in Sri Lanka and West Indies? Are overseas performances in temperate conditions the Holy Grail for spinners? Is it easier to bowl as an away spinner in the subcontinent? To answer some of these questions, the next step would be to understand the nuances of bowling statistics across host countries. This can be done by examining the differences in bowling averages of home and away spinners. A high BA for an away spinner would indicate that either the home batsmen are competent against spin, or that the conditions are not favourable for spinners (or both). The corresponding BA values of home spinners can also be used to make a judgement; negative values of BA differences (Home spinners BA-Away spinners BA) imply that the home spinners have out-bowled the away ones. In the case of Pakistan, UAE has been designated as a home venue.

7

Fig. 7: Overall bowling average of home and away spin bowlers across different countries. UAE has been treated as a home venue for Pakistan.

It can be observed from the table that India, Pakistan and Sri Lanka have been great home venues for spinners – a no brainer; on the other hand, away spinners have traditionally prospered in countries where batting has been weak. There also seems to be some truth to sub-continental batsmen being comfortable against away spinners; though, we don’t have the true picture of this “dominance” as they don’t get to face home spinners. One more thing to be noted here is that these values of BA are not fixed, but move with time based on a team’s strength. As we’ll take note shortly, the home BA values are great even in a non-subcontinental country when a good spinner plays for the home team.

8

Fig. 8: Variation in home spinner bowling averages at host country over each decade. UAE has been treated as a home venue for Pakistan.

A good way to check this out would be to examine the evolution of BA in different host countries across each decade. A decade is a good unit of time as it would include data from a lot of matches. Of course, there could be an odd case of data missing from a team in transition around the turn of the decade, but a 10 year span is a convenient time span to measure the progress of a team.

Since the overall bowling average of a spin bowler during the time of consideration is ~35, we can use this as a benchmark. From the table, it can be observed that Australia, England or West Indies were not always a barren place for spinners. Low overall values of home spinner BAs can be observed in those locations during the time of Richie Benaud, Jim Laker, Lance Gibbs, Shane Warne, Derek Underwood, Graeme Swann etc. India and Sri Lanka took some time to figure out that spin was their strength. On the other hand, New Zealand and South Africa are yet to see a champion spinner. Of particular interest are class-leading home spinner BA of ~24 for Sri Lanka during the 2000s and ~25.8 for India during 2010s.

How have away spinners fared on tours to different countries during these times?

9

Fig. 9: Variation in away spinner bowling averages at host country over each decade. UAE has been treated as a home venue for Pakistan.

The above table reveals many insights: Australia has been the toughest place to visit for an overseas spinner; Bangladesh have improved their record against spinners recently; pitches in England assisted spin in Laker’s time (batsmen were perhaps average in the 1990s); once India, Pakistan, and Sri Lanka found their batting giants, touring spinners never had it easy; New Zealand have not been pushovers against spin since the 1980s; South Africa took their time to adjust against spinners; and, the decline of Zimbabwe and West Indies are apparent. In the decade of the 1990s, all teams boasted good records against spinners.

So, which were the best places to tour as a spinner at different points of time?

10

Fig. 10: Variation in bowling averages differences (home spin BA- away spin BA) at host country over each decade. UAE has been treated as a home venue for Pakistan.

Using the same difference in bowling average measure, we can find periods in cricketing history when away spinners dominated over the home team. Here too, several patterns emerge: The 3 older subcontinental teams have rarely been outdone by their counterparts; England’s spinners underperformed for 3 decades; New Zealand has been a happy hunting ground until recently, the opposite holds true for the Windies; Australian spinners did not do well at home in the ‘70s; South Africa has never had a spin bowling champion; Bangladesh are fast closing the gap and Zimbabwe have slipped to oblivion. With all this information in hand, we can come to the following conclusions:

  • Fledgling teams take some time to get comfortable against spin, even in home conditions.
  • By the time batting strength is developed at home, away spinners are not as effective.
  • In general, home spinners do better than away spinners when teams are of similar strengths.

Using this, we can now prepare a list of selected host countries (discarding records where away spinner BA<30) to separate the wheat from the chaff. Why? We mustn’t forget that many aspersions have been cast on Warne’s and Murali’s records due to their tallies against England, Bangladesh and Zimbabwe at various points of time during their career. Hence, we need to address this issue of opposition quality adequately using exclusions.

11

Fig. 11: List of host countries in each decade where the home team has had a poor record against away spinners (BA<30). These host countries were excluded from the away spinner BA analysis for each decade.

We can now proceed to examine spinner performances away from home across different time periods, keeping in mind these exclusions; we wouldn’t want to set the bar low, would we?

12

Fig. 12: List of spin bowlers with (minimum number of away wicket cutoff applied) BA

For the eight decades in question, we need to come up with an objective selection criteria. The number of minimum wickets captured by a bowler is a function of the length of the decade and the number of matches played away against opposition with “good” credentials of playing spin. In the first decade under consideration, no spinner averaged less than 30 away (all countries except NZ). The top spinner was Jim Laker, who averaged a shade over 30 in this war-truncated decade (minimum 15 wickets). Moving on to the 1950s, the bar can be set at 25 away wickets, which would translate to tallies over at least 2 series. There are four spinners who have excellent away figures, led by the illustrious Richie Benaud. During the decade, his wicket taking feats were ably supported by Davidson, Lindwall and Miller. The pattern repeats for Tayfield, Valentine and Laker, the other spinners in this list; every one of these bowlers had the support of fast bowlers who similarly averaged less than 30 in these conditions.

The same motif repeats itself in all the other decades; spinners from teams having a good set of fast bowlers have much better returns against the “good” teams in away conditions. Tweakers like Hedley Howarth (NZ), Geoff Miller (England), Roger Harper (WI) and Paul Adams (SA) boast a better record when compared to noteworthy names such as Prasanna, Chandrashekhar, Bedi, Qadir, Kumble and Harbhajan. The only spinner to buck this trend of having fast-bowling support is peak level Muralitharan in the ‘00s – snaring his victims at nearly 29 runs/dismissal, a far cry from the sub-20 levels he hit during in his pomp. For the last 3 decades, the bar has been set at 40 wickets since the number of host countries has increased. In the 2010s, no bowler has been able to average at less than 30 runs/dismissal. The top bowler is Saeed Ajmal, who was slightly over the benchmark. Unsurprisingly, he had Mohammad Amir’s support during this current decade.

These trends shouldn’t come as a complete surprise to the cricket fans who’ve followed the game for a while. On an average, fast bowlers have better bowling returns compared to spinners; the most successful test teams of all-time boasted of some fearsome quicks in their pack; the bowling is opened by the pacers, who set the agenda for the spinners to follow; bowlers tend to bowl better with a better peer-group. Thereby, spinners profiting from the inroads made by fast-bowling colleagues follows as a natural consequence.

On this note, the odds are very much against Ashwin bowling really well abroad against the better teams, given the lack of Indian fast bowling pedigree. Then again, Ashwin has achieved more than any spinner during the start of his career (except perhaps Clarrie Grimmett). Like his predecessors, he needs to maximize his returns against the “weaker” away teams such as Bangladesh, West Indies, Sri Lanka and New Zealand and hope for an odd good series against the rest. India would certainly hope for Mohammed Shami and co. to develop as all-weather fast bowlers to aid him in his quest. All said and done, a fascinating sub-plot lies in front of us this time next year, when India tour South Africa.

Disclaimer: Some images used in this article are not property of this blog. The copyright, if any, rests with the respective owners.

Links: India cricket roundup

  1. The big news this weekend has to be about the BCCI (no, not the Supreme court saga) – it has finally warmed up to the new and improved Decision Review System (DRS). The DRS will be in place for the upcoming India-England series. Although, it has been prefaced with a “trial basis” phrase. The review of the DRS seems enough recursion to keep a computer scientist happy. Estsentially, BCCI was tickled enough with the improved ball tracking system and has bitten the bullet. Aggers at BBC seems to be worried about it though; given DRS’ tilt towards the LBW and no Graeme Swann, looks like the shoe is on the other boot.
  2. The Supreme court has hit the BCCI where it hurts and delivered a metaphorical low-blow by clipping its financial wings. The BCCI seems to have found its match in the Supreme court and this latest ruling has found its mark; the upcoming IPL bids have been postponed. This is not going to end easily.
  3. The tour dates for Australia’s tour to India are out and three new stadiums (Pune, Ranchi and Dharamshala) are set to make their debuts as test venues. The new venues are a bonus as the metro cities tend to be jaded with the IPL eating into cricket watching dates in the stadium. What is bizarre is that  Australia play a test in India only a day after a T20 in Australia. This is especially reminiscent of two Indian squads being selected for overlapping tournaments (the 1998 Commonwealth games in Malaysia and the Sahara cup in Toronto). Ajay Jadeja and Sachin Tendulkar racked up some serious air miles to play in the latter tournament after they were knocked out in Malaysia.