In the second match of the previous ODI series against New Zealand last year, India won the toss and elected to field at the Feroz Shah Kotla. They even managed to restrict the Kiwis to a score of 242 after they were comfortably placed at 202/3 by the end of the 40th over. However, come chasing time, they faltered – 40/2 quickly became 73/4 after a silly run out; the match seemed a lost cause once Dhoni was dismissed 65 runs adrift of the target. Just as the last rites of the match were being read in the 41st over at 183/8, Hardik Pandya’s innings was the hand that came out of the grave, but to no avail. India lost by six runs and capped a wretched 19 months. If their series against Zimbabwe was ignored, since the Ides of March in 2015, they had won only two matches while chasing. Every loss was another shot fired at its self-esteem.
The numbers confirm that India have fallen from their peak during 2011-2013, where they won in adverse circumstances – the World Cup (chasing a high score), and the Champions Trophy (defending a low score). In those three world beating years, the Indian team’s Win-Loss ratio (W/L) was amongst the top 2 in the world, either while setting a target or chasing it; they still stood in their lofty position even if the playing field is reduced to the top-9 nations (barring Zimbabwe).
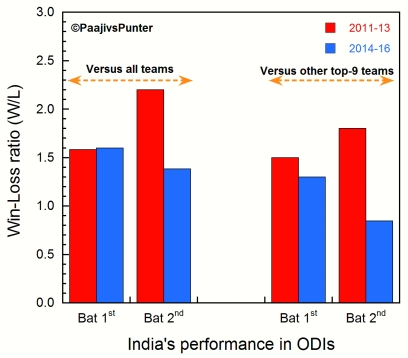
Chasing deficit: India’s W/L record against all & top 9 teams while batting 1st & 2nd, during the two time periods
Their recent decline (2014-2016) can observed in the above plot, where every blue bar is shorter than its red counterpart; though the team of recent vintage is close in terms of setting the target (Batting 1st), it has registered a massive decline in its chasing fortunes, especially against the top teams. But, isn’t it possible that India won a lot of matches chasing low scores or defending a high score, rather than a tight, 50-50 match as described earlier? To examine this further, it is worth investigating the data from Statsguru.
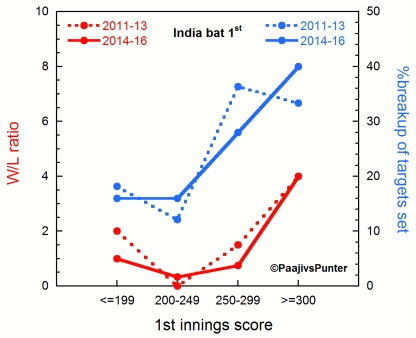
First batting intact: Plot of W/L ratio and India’s total scoring distribution versus top-9 teams. Recently, India has set 300+ targets more often and the W/L ratio has not suffered.
A way to represent the scoreboard pressure data is to plot how India’s W/L ratio varies with its 1st innings score. In the above graph, the red lines represent the W/L ratio, and the blue lines represent the % breakup of targets set, at different score ranges versus top-9 teams. Hence, the blue line is a measure for how India were able to create scoreboard pressure. For example, between 2014-16, 40% of India’s first innings scores were above 300, and they ended up notching a W/L of 4 in those 10 matches.
Similarly, a measure of India’s dominance between 2011-13 can be obtained as well: they had the best W/L ratio while defending a sub-200 score (some of these being rain-hit matches) against top opponents – the most memorable one being the 2013 Champions trophy final. As it is increasingly difficult to win matches with high targets, it is reasonable to expect the W/L graph to rise as the target goes higher. It can be noted that India’s batting first credentials against the top teams is still intact; not only have India registered 300+ scores more often, their W/L ratio is also in good shape.

Chasing woes: Plot of W/L ratio and breakup of runs chased by India versus top-9 teams. Recently, India have conceded 300+ totals more often and lost more matches across the board while chasing.
Now to the crux of the matter: If a similar plot is made for India’s W/L record in chases and the %breakup of runs chased, one can expect a slightly different looking graph (for the blue lines, that is). Since it is more difficult to chase a high score compared to a low one, one can expect the W/L ratio to decrease with an increase in target. In the above plot, India’s chasing prowess when the target is less than or equal to 200 (or, 1st innings score being <=199) is intact as India have not lost a single such match in the last six years. Since the W/L is not defined in this case, the data points have not been shown.
Looking keenly into the plot makes two themes stand out: not only have India been more profligate in their bowling, as seen by a recent increase of conceding 300+ scores, but also have suffered while chasing these scores. In 250+ run chases, they have regressed from their top position previously, to a lowly sixth. India haven’t covered themselves in glory at lower score range as well; their recent W/L record has been markedly inferior at almost every score range.
The on-field events suggest that India’s top opponents have taken note of this weakness: since 1 Jan 2014, India have been asked to chase on 13 of the 22 occasions after having lost the toss. The most damning indictment being, every time India have lost the toss against the top team and being asked to chase since 15th March 2015, they have lost every single time. This may have played on Dhoni’s mind as well – after winning only 2 matches out of 9 upon winning the toss and electing to chase, India selected to bat first the next 12 times the flip of the coin went their way (winning 7 out of 12 matches).
On this note, India’s title defence in this year’s Champions trophy looks on shaky ground. While India’s recent bat first record has been steady and have mounted taller scores more often, they’ve picked up a tendency to concede a high number of 250+ totals and lose. The team may have won the last one with the rub of the green going its way; but based on this evidence, India should certainly be hoping for the coin to land in its favour, and bat first.
